![Space Jam: A Traffic Problem in the Future? [Class 8 Ganita Prakash] - Line Graphs](https://cdn.teachoo.com/35e33224-b087-4ce5-9dfd-e0ca51b7152e/slide11.jpg)

Last updated at March 5, 2026 by Teachoo
Transcript
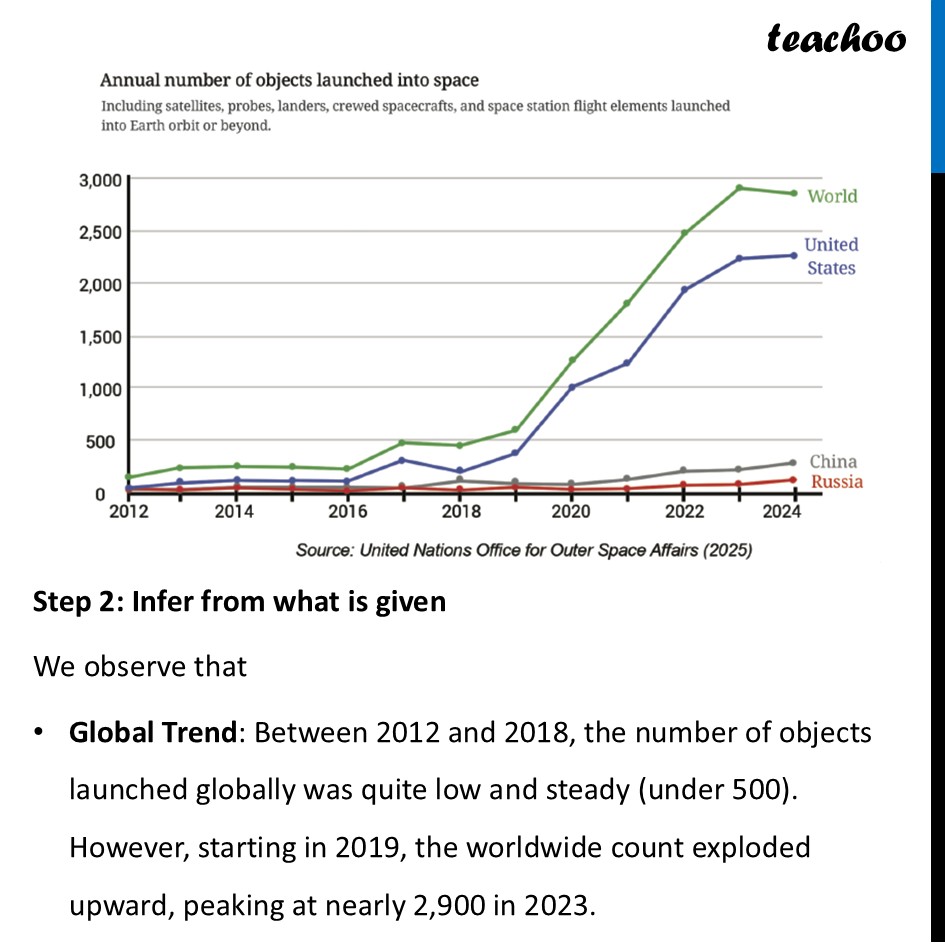
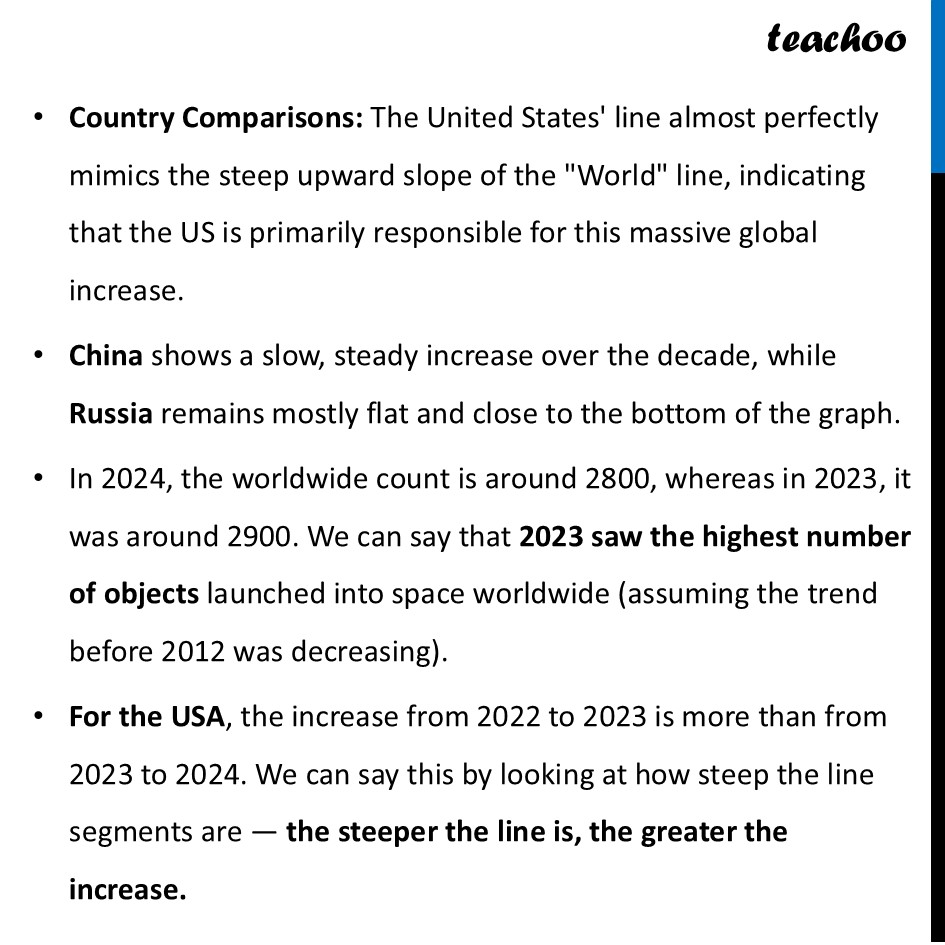
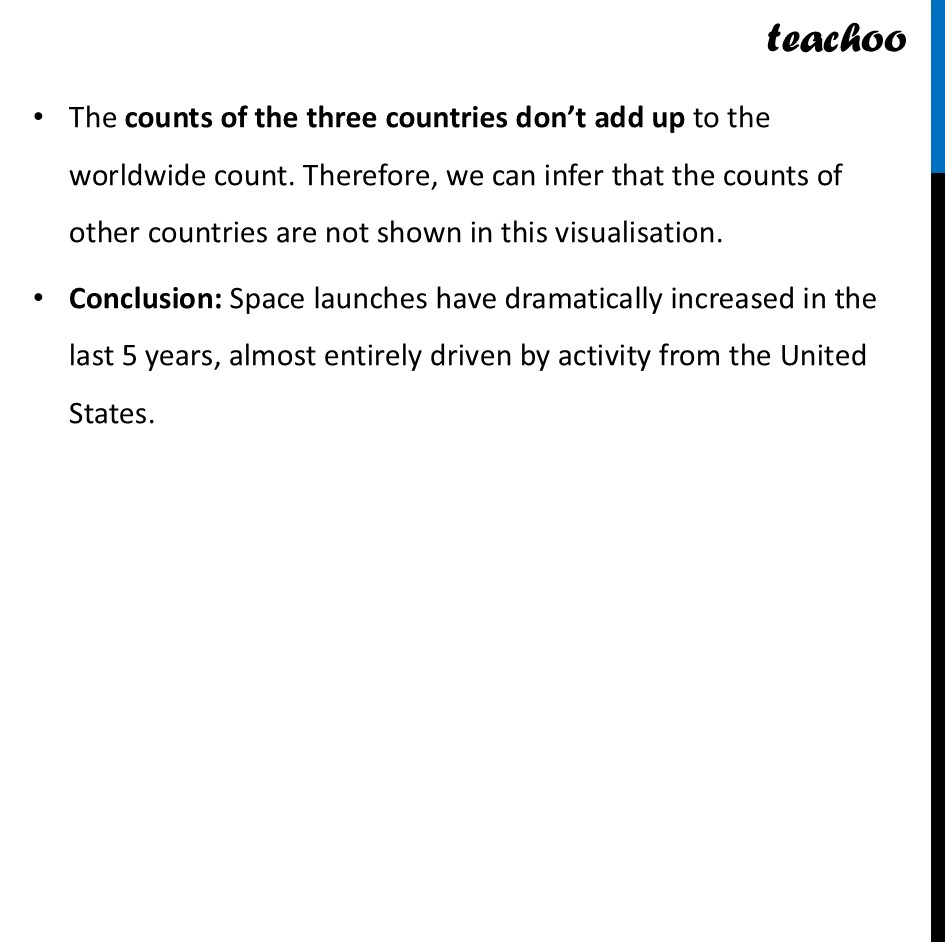
Space Jam: A Traffic Problem in the Future?Given is a Line graph for Annual objects launched in space by different countries from 2012 to 2024 To read it we follow the "2-Step Process" The "2-Step Process" to Understanding Graphs Step 1: Identify what is given Look at the axes and the scale. Horizontal Line (x-axis): It shows Years Vertical Line (y-axis): Number of objects launched in space Legend: Green = World, Blue = United States, Grey = China, Red = Russia Step 2: Infer from what is given We observe that Global Trend: Between 2012 and 2018, the number of objects launched globally was quite low and steady (under 500). However, starting in 2019, the worldwide count exploded upward, peaking at nearly 2,900 in 2023. Country Comparisons: The United States' line almost perfectly mimics the steep upward slope of the "World" line, indicating that the US is primarily responsible for this massive global increase. China shows a slow, steady increase over the decade, while Russia remains mostly flat and close to the bottom of the graph. In 2024, the worldwide count is around 2800, whereas in 2023, it was around 2900. We can say that 2023 saw the highest number of objects launched into space worldwide (assuming the trend before 2012 was decreasing). For the USA, the increase from 2022 to 2023 is more than from 2023 to 2024. We can say this by looking at how steep the line segments are — the steeper the line is, the greater the increase. The counts of the three countries don’t add up to the worldwide count. Therefore, we can infer that the counts of other countries are not shown in this visualisation. Conclusion: Space launches have dramatically increased in the last 5 years, almost entirely driven by activity from the United States.
