Last updated at March 5, 2026 by Teachoo
Transcript
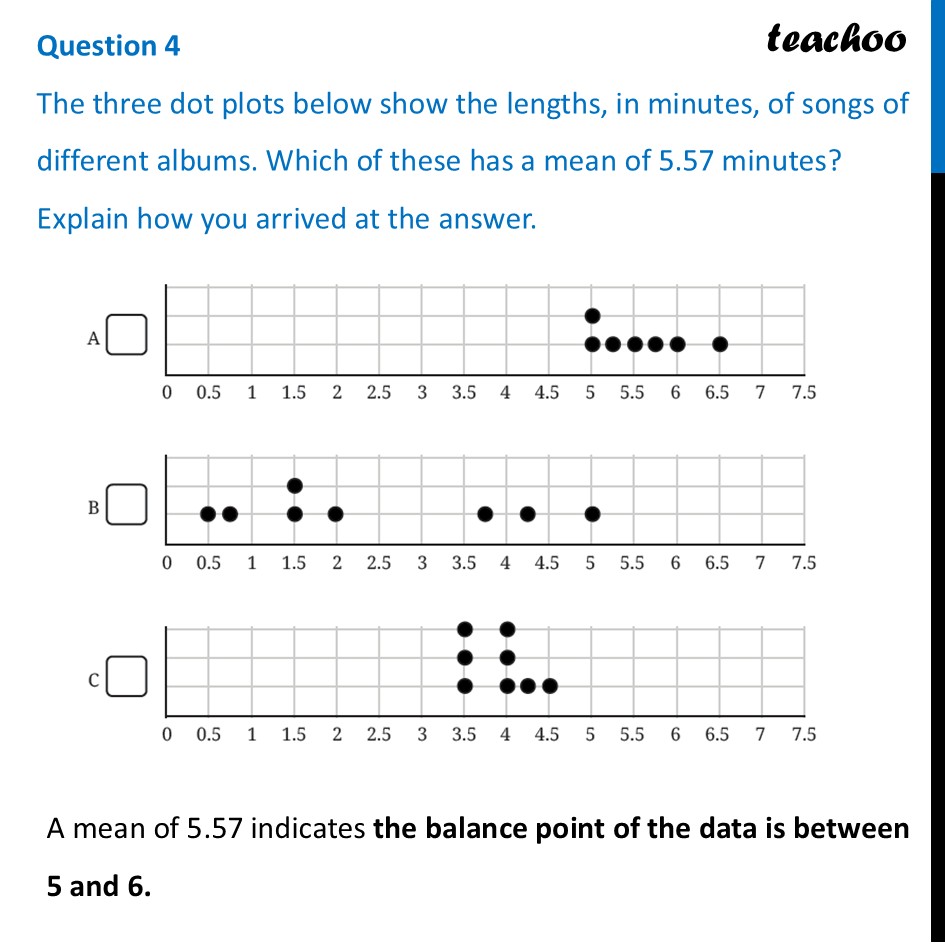
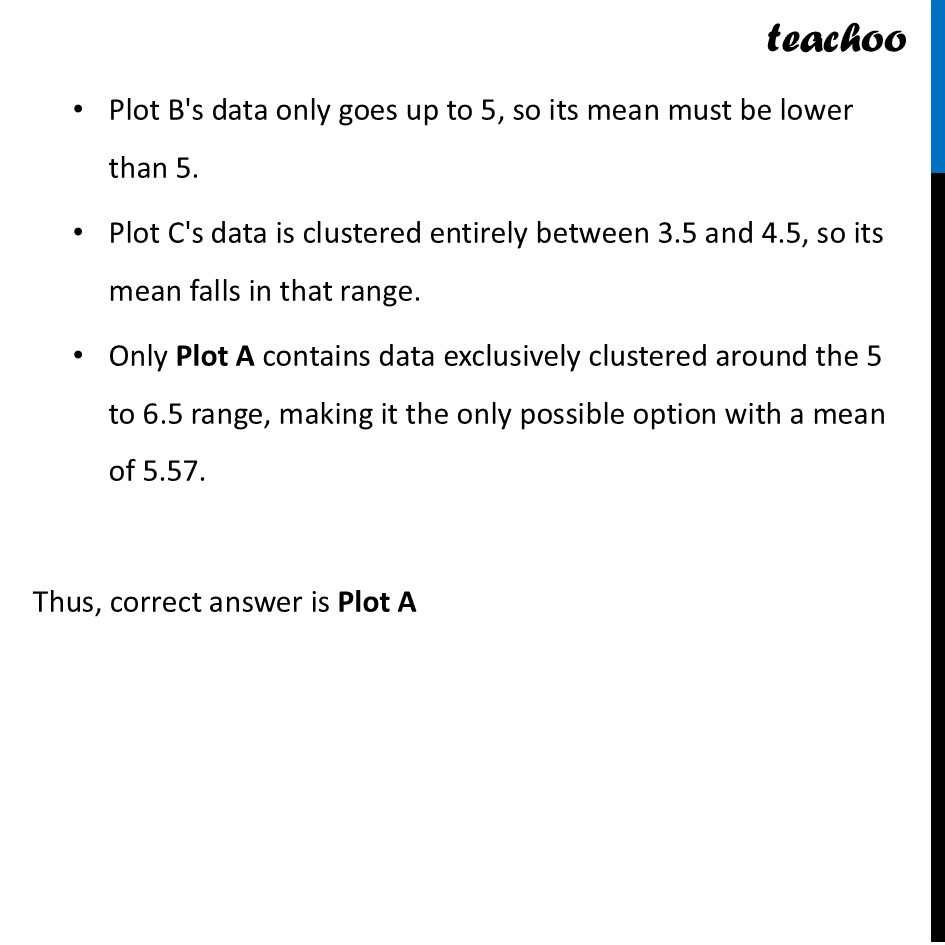
Question 4 The three dot plots below show the lengths, in minutes, of songs of different albums. Which of these has a mean of 5.57 minutes? Explain how you arrived at the answer.A mean of 5.57 indicates the balance point of the data is between 5 and 6. Plot B's data only goes up to 5, so its mean must be lower than 5. Plot C's data is clustered entirely between 3.5 and 4.5, so its mean falls in that range. Only Plot A contains data exclusively clustered around the 5 to 6.5 range, making it the only possible option with a mean of 5.57. Thus, correct answer is Plot A
