Last updated at March 5, 2026 by Teachoo
Transcript
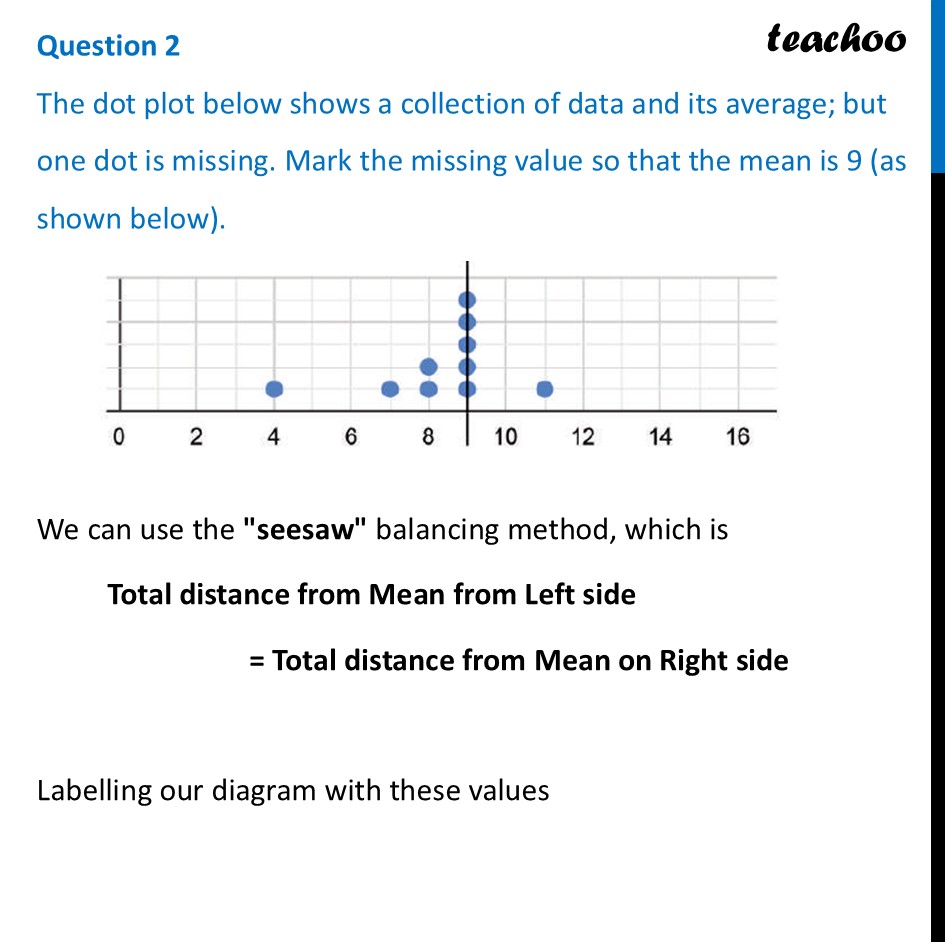
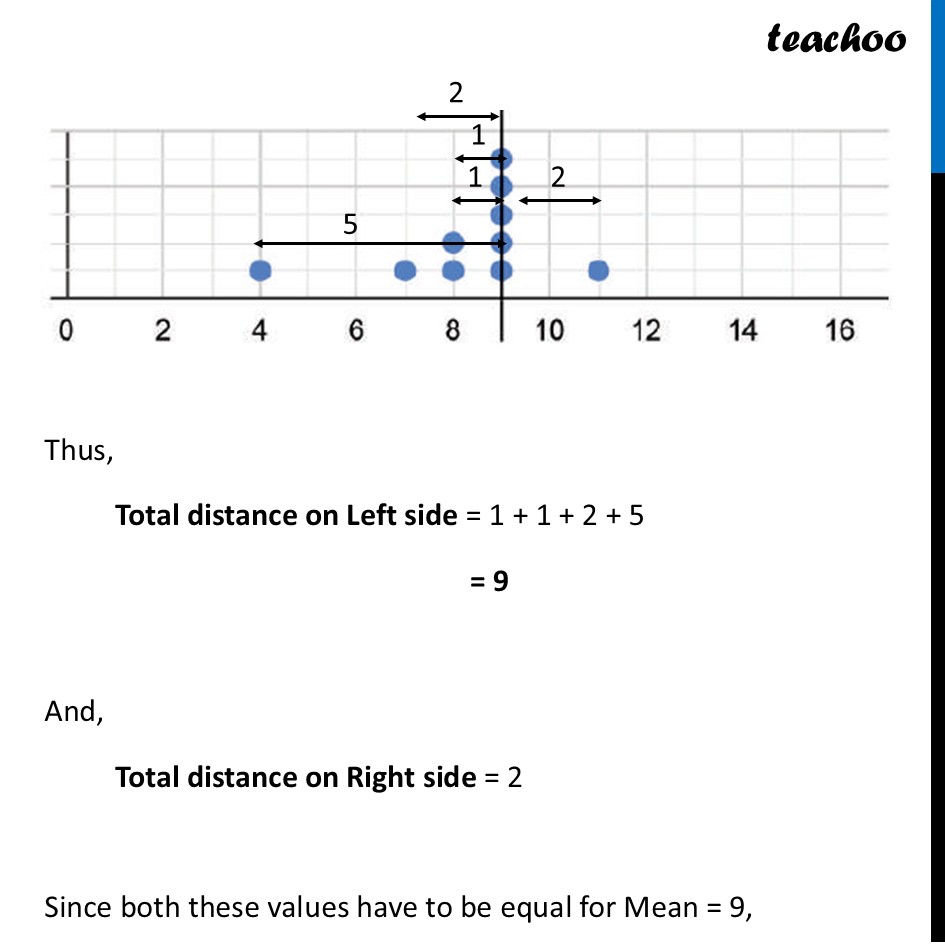
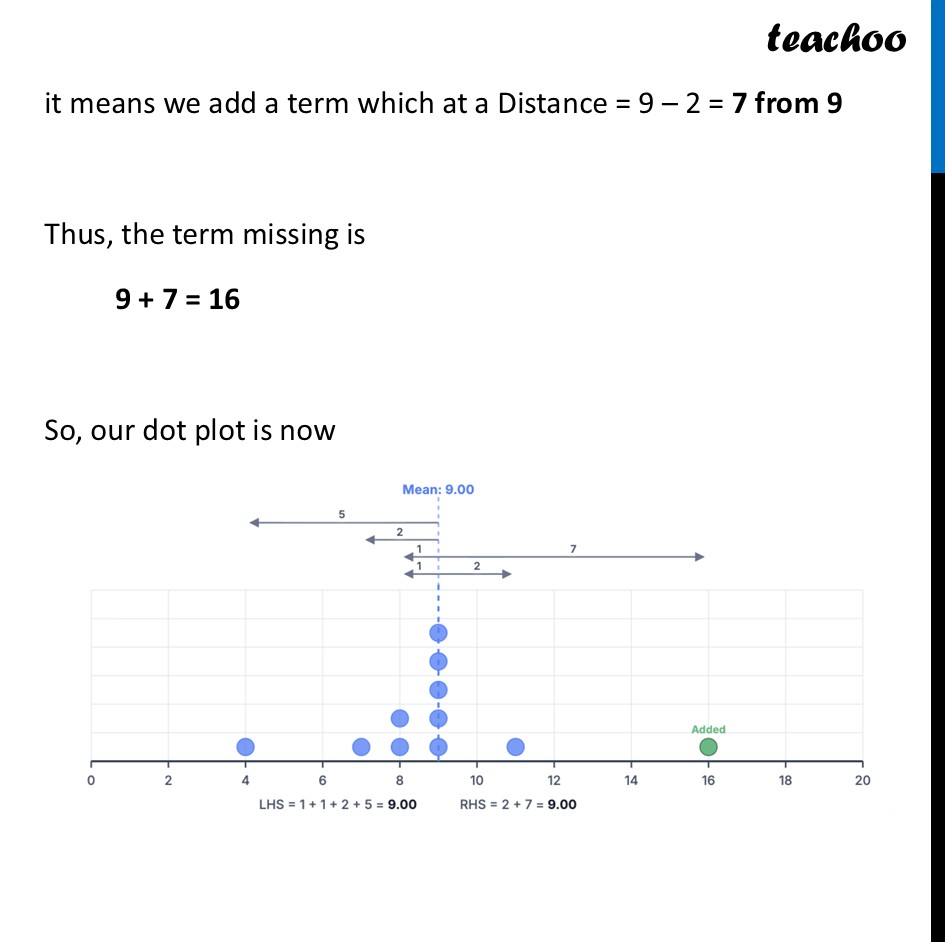
Question 2 The dot plot below shows a collection of data and its average; but one dot is missing. Mark the missing value so that the mean is 9 (as shown below).We can use the "seesaw" balancing method, which is Total distance from Mean from Left side = Total distance from Mean on Right side Labelling our diagram with these values Thus, Total distance on Left side = 1 + 1 + 2 + 5 = 9 And, Total distance on Right side = 2 Since both these values have to be equal for Mean = 9, it means we add a term which at a Distance = 9 – 2 = 7 from 9 Thus, the term missing is 9 + 7 = 16 So, our dot plot is now
