Figure it out - Page 122-125
Last updated at February 2, 2026 by Teachoo
Transcript
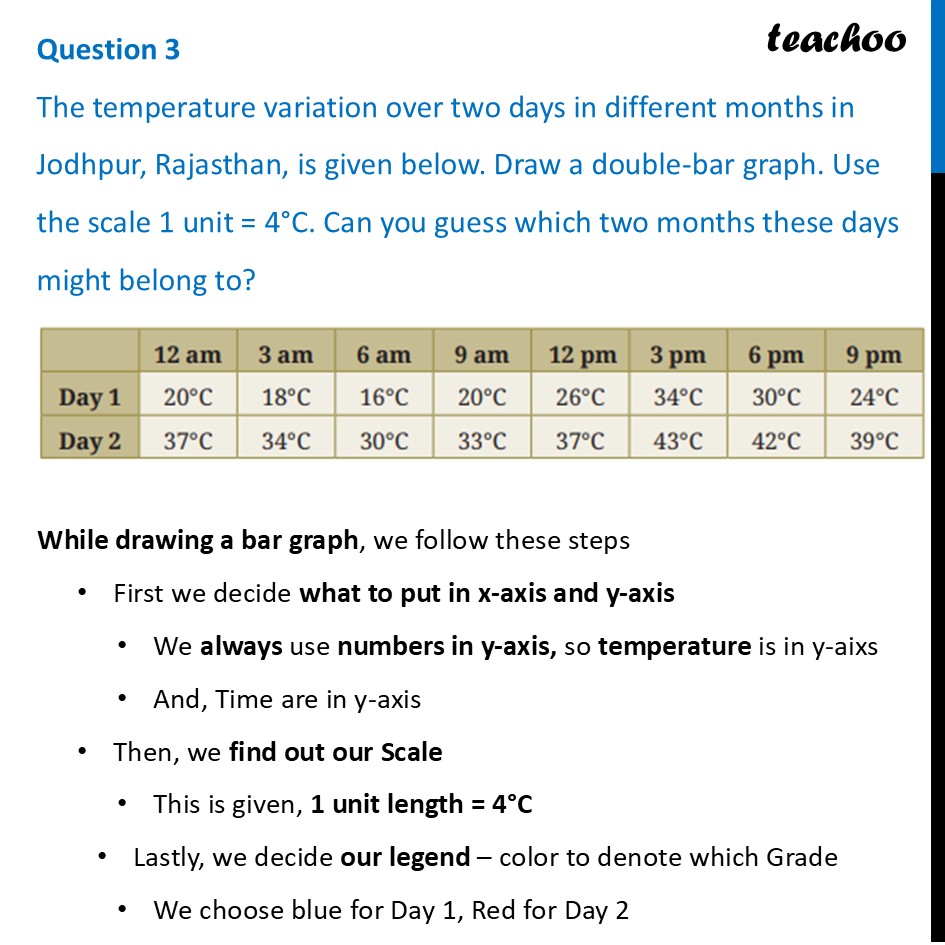
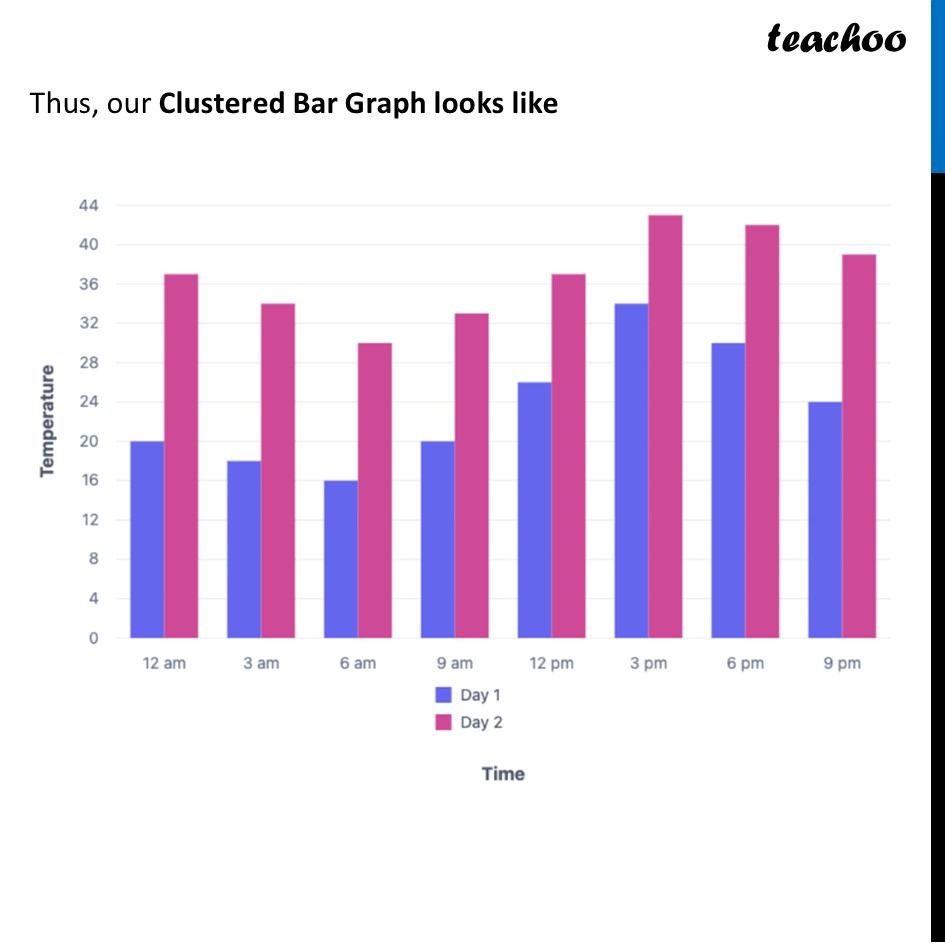
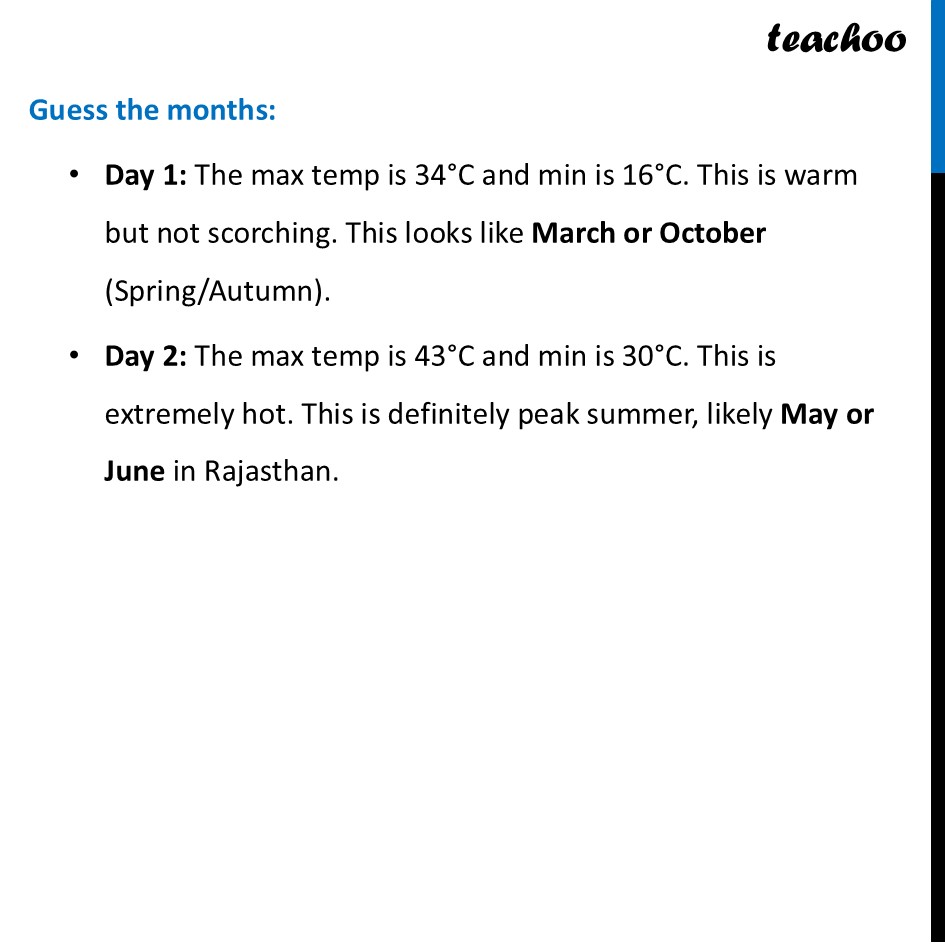
Question 3 The temperature variation over two days in different months in Jodhpur, Rajasthan, is given below. Draw a double-bar graph. Use the scale 1 unit = 4°C. Can you guess which two months these days might belong to?While drawing a bar graph, we follow these steps First we decide what to put in x-axis and y-axis We always use numbers in y-axis, so temperature is in y-aixs And, Time are in y-axis Then, we find out our Scale This is given, 1 unit length = 4°C Lastly, we decide our legend – color to denote which Grade We choose blue for Day 1, Red for Day 2 Thus, our Clustered Bar Graph looks like Guess the months: Day 1: The max temp is 34°C and min is 16°C. This is warm but not scorching. This looks like March or October (Spring/Autumn). Day 2: The max temp is 43°C and min is 30°C. This is extremely hot. This is definitely peak summer, likely May or June in Rajasthan.
