Last updated at January 30, 2026 by Teachoo
Transcript
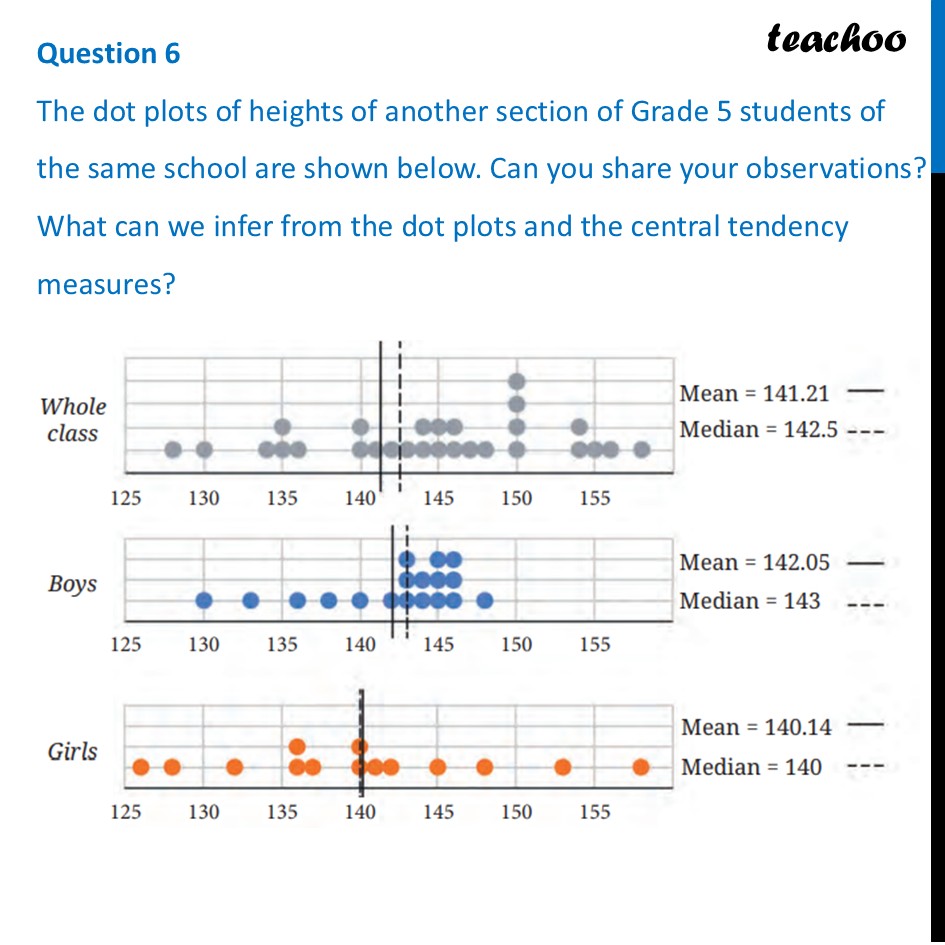
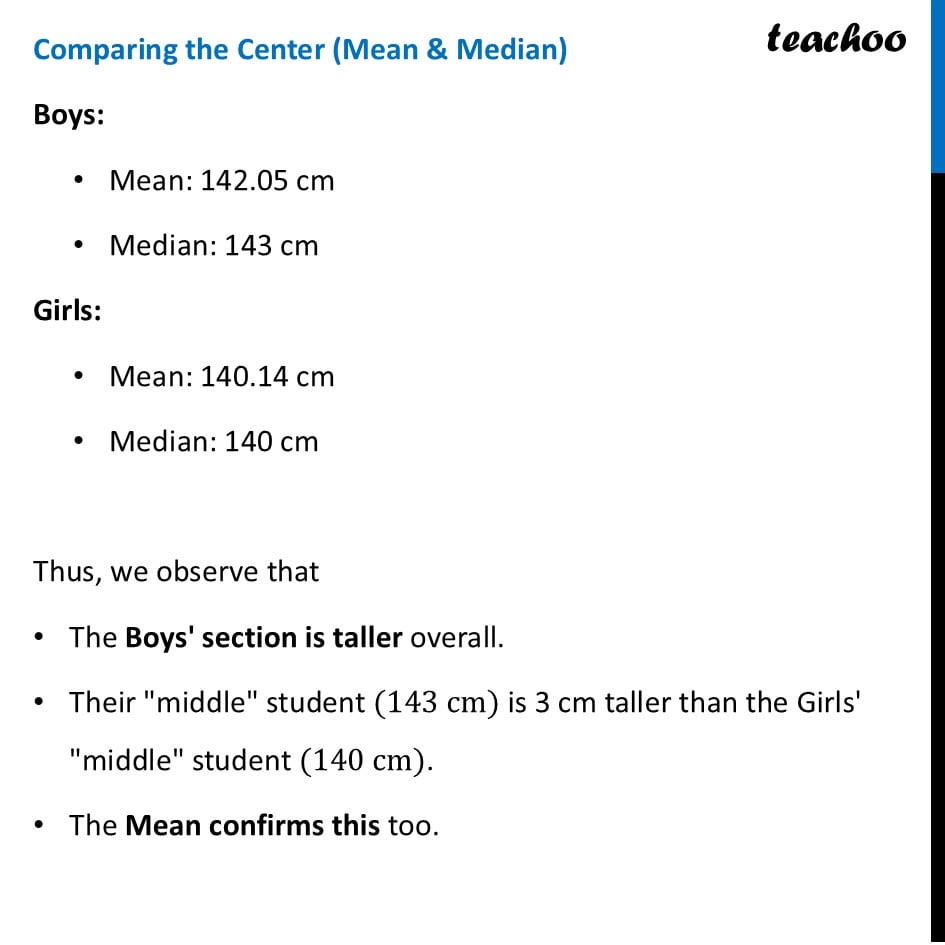
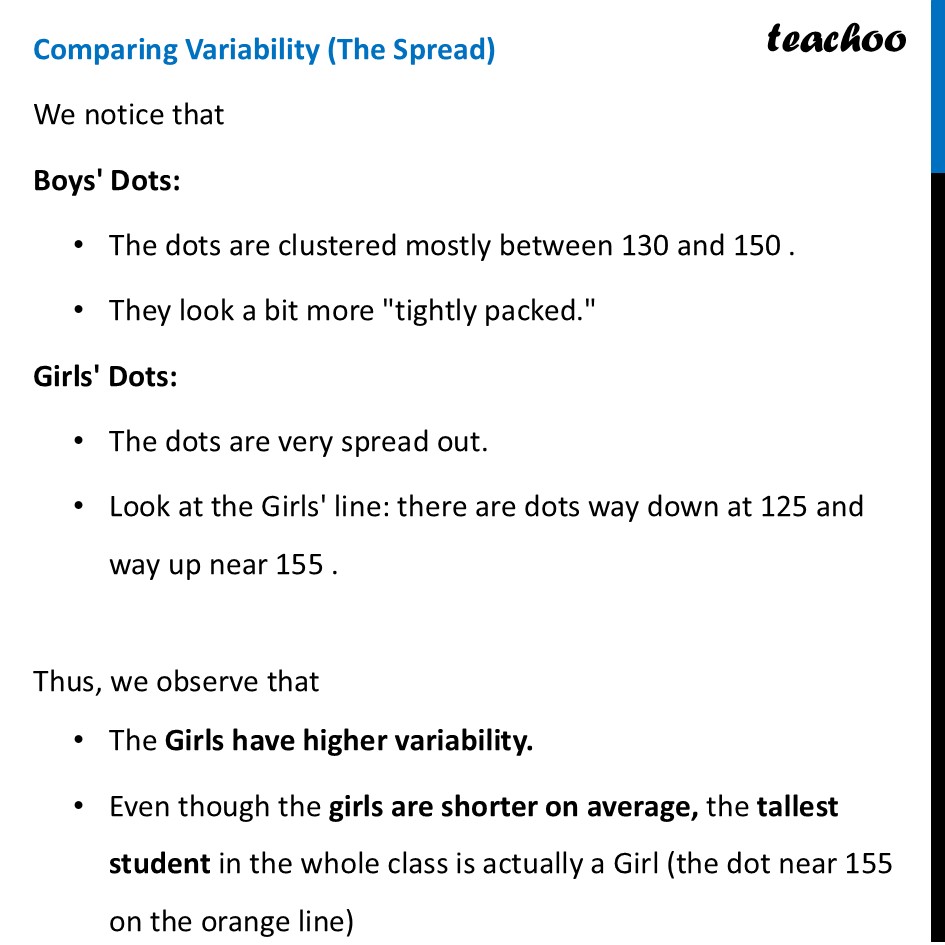
Question 6 The dot plots of heights of another section of Grade 5 students of the same school are shown below. Can you share your observations? What can we infer from the dot plots and the central tendency measures?Comparing the Center (Mean & Median) Boys: Mean: 142.05 cm Median: 143 cm Girls: Mean: 140.14 cm Median: 140 cm Thus, we observe that The Boys' section is taller overall. Their "middle" student (143" " cm) is 3 cm taller than the Girls' "middle" student (140" " cm). The Mean confirms this too. Comparing Variability (The Spread) We notice that Boys' Dots: The dots are clustered mostly between 130 and 150 . They look a bit more "tightly packed." Girls' Dots: The dots are very spread out. Look at the Girls' line: there are dots way down at 125 and way up near 155 . Thus, we observe that The Girls have higher variability. Even though the girls are shorter on average, the tallest student in the whole class is actually a Girl (the dot near 155 on the orange line) But the shortest student is also a Girl (the dot at 125). The boys are more consistent in their height.
