Last updated at January 30, 2026 by Teachoo
Transcript
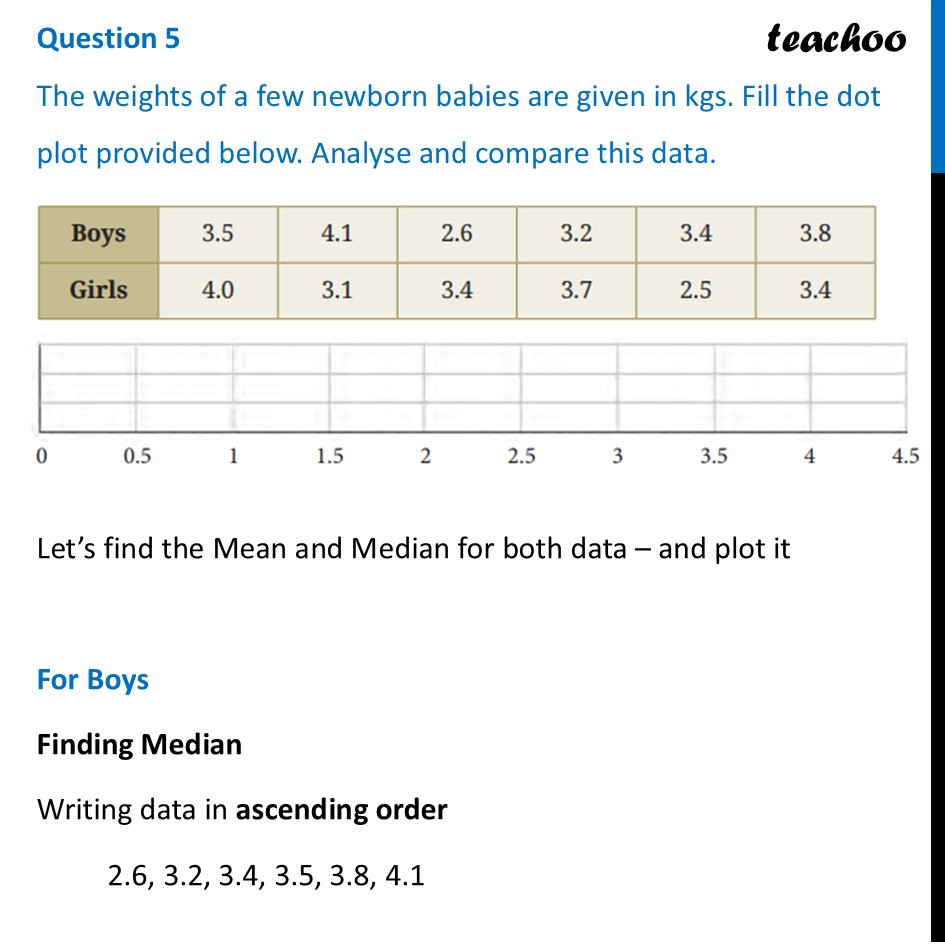
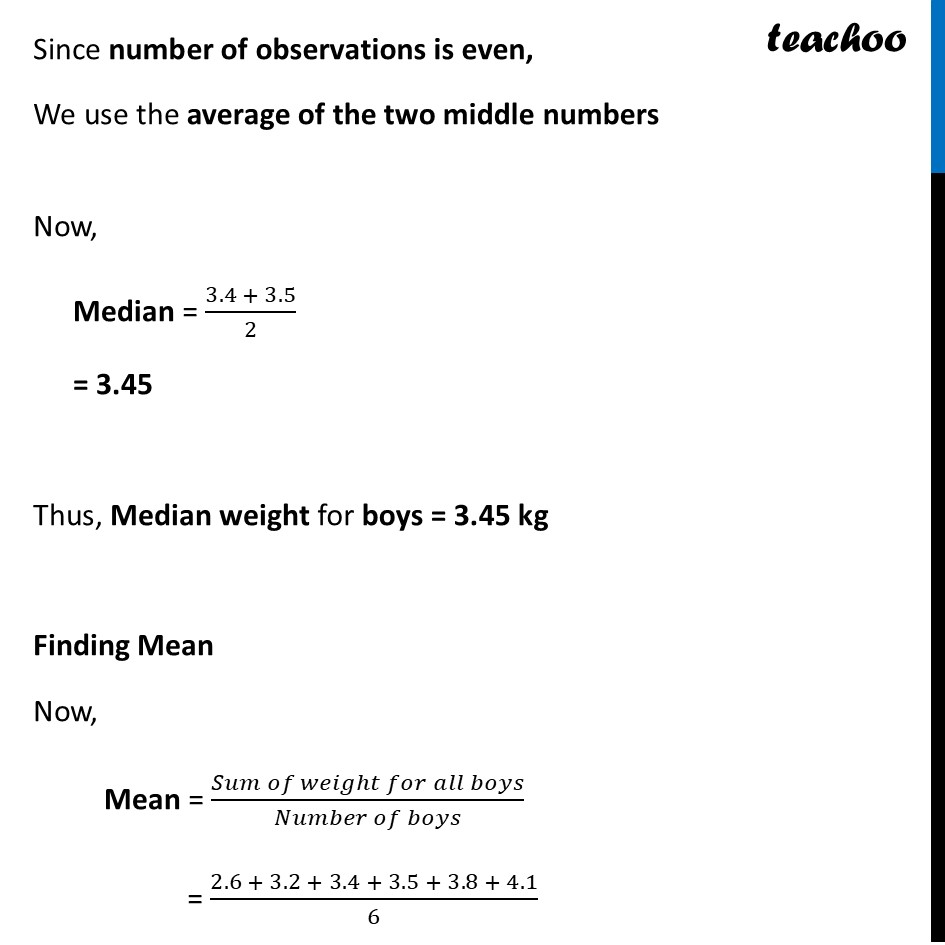
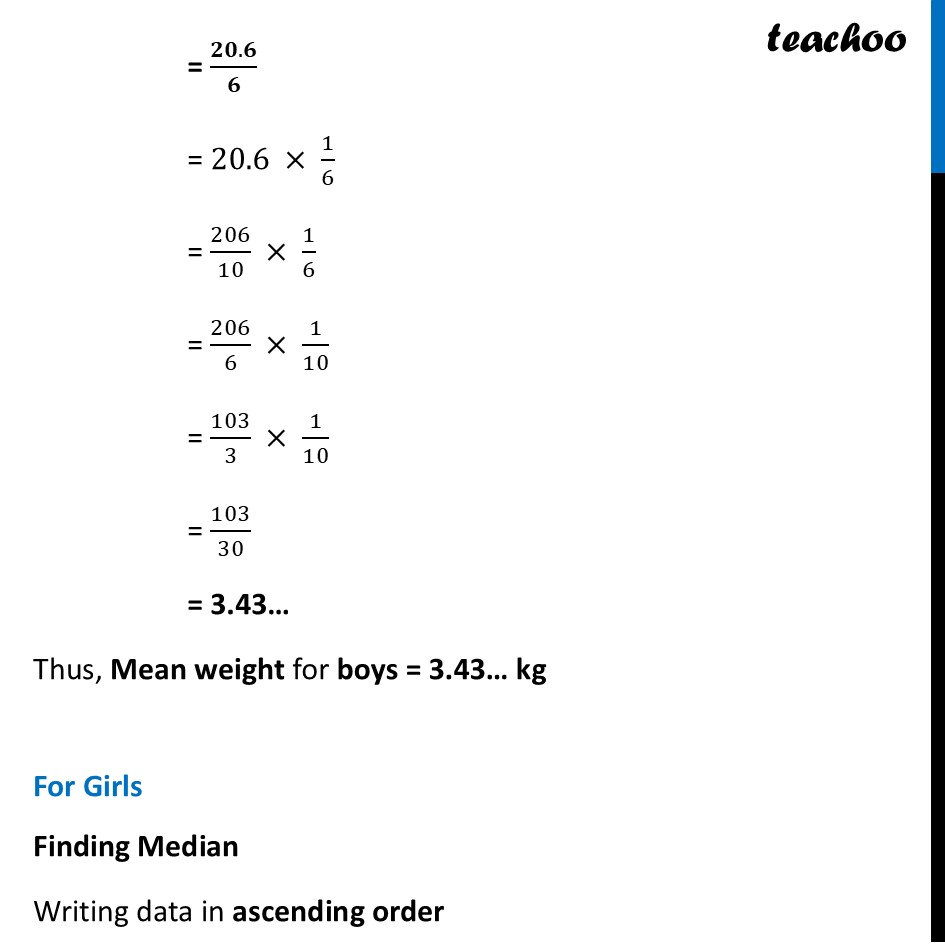
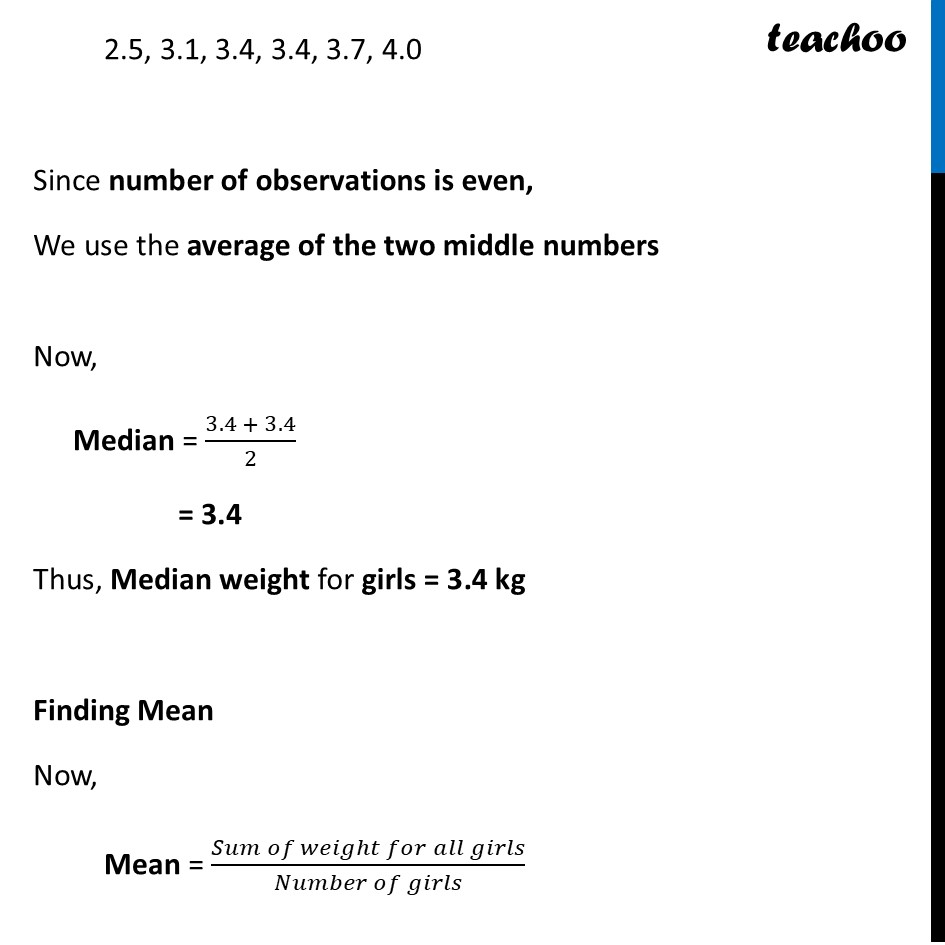
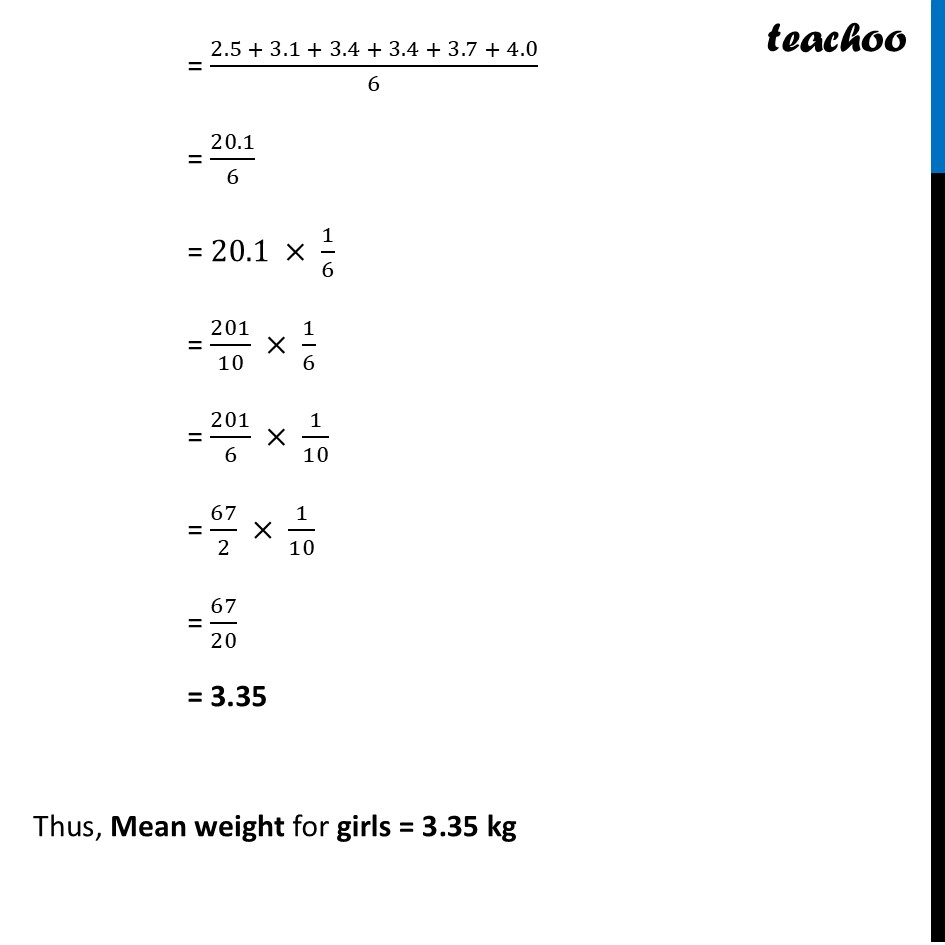
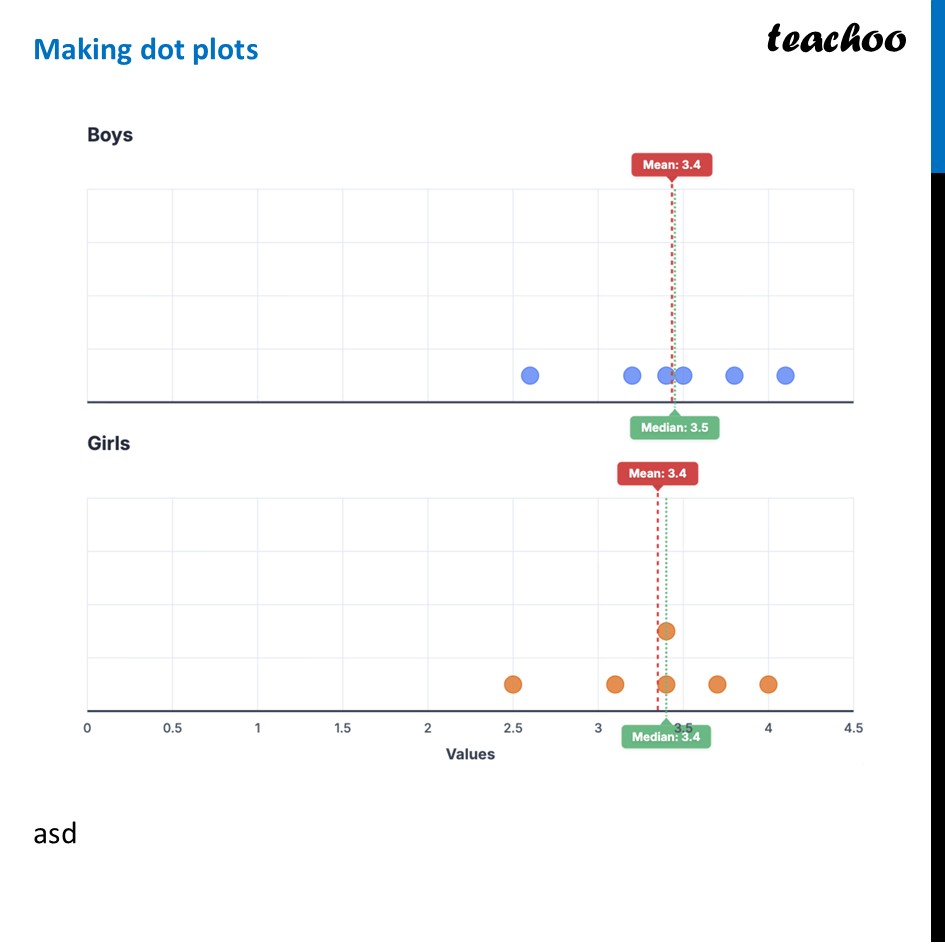
Question 5 The weights of a few newborn babies are given in kgs. Fill the dot plot provided below. Analyse and compare this data.Let’s find the Mean and Median for both data – and plot it For Boys Finding Median Writing data in ascending order 2.6, 3.2, 3.4, 3.5, 3.8, 4.1 Since number of observations is even, We use the average of the two middle numbers Now, Median = (3.4 + 3.5)/2 = 3.45 Thus, Median weight for boys = 3.45 kg Finding Mean Now, Mean = (𝑆𝑢𝑚 𝑜𝑓 𝑤𝑒𝑖𝑔ℎ𝑡 𝑓𝑜𝑟 𝑎𝑙𝑙 𝑏𝑜𝑦𝑠)/(𝑁𝑢𝑚𝑏𝑒𝑟 𝑜𝑓 𝑏𝑜𝑦𝑠) = (2.6 + 3.2 + 3.4 + 3.5 + 3.8 + 4.1)/6 = (𝟐𝟎.𝟔)/𝟔 = 20.6 × 1/6 = 206/10 × 1/6 = 206/6 × 1/10 = 103/3 × 1/10 = 103/30 = 3.43… Thus, Mean weight for boys = 3.43… kg For Girls Finding Median Writing data in ascending order 2.5, 3.1, 3.4, 3.4, 3.7, 4.0 Since number of observations is even, We use the average of the two middle numbers Now, Median = (3.4 + 3.4)/2 = 3.4 Thus, Median weight for girls = 3.4 kg Finding Mean Now, Mean = (𝑆𝑢𝑚 𝑜𝑓 𝑤𝑒𝑖𝑔ℎ𝑡 𝑓𝑜𝑟 𝑎𝑙𝑙 𝑔𝑖𝑟𝑙𝑠)/(𝑁𝑢𝑚𝑏𝑒𝑟 𝑜𝑓 𝑔𝑖𝑟𝑙𝑠) = (2.5 + 3.1 + 3.4 + 3.4 + 3.7 + 4.0)/6 = 20.1/6 = 20.1 × 1/6 = 201/10 × 1/6 = 201/6 × 1/10 = 67/2 × 1/10 = 67/20 = 3.35 Thus, Mean weight for girls = 3.35 kg Making dot plots asd Comparison & Conclusion Central Tendency (Mean & Median): The Boys are slightly heavier than the Girls. Both the Mean (3.43 vs 3.35) and the Median (3.45 vs 3.4) confirm this. Variability: Interestingly, the variability is identical (1.5 kg for both). This means the "gap" between the lightest and heaviest baby is the same for both groups. Final Observation: While the boys are heavier on average, the difference is very small (less than 100g), and the spread of weights is exactly the same.
