Last updated at January 30, 2026 by Teachoo
Transcript
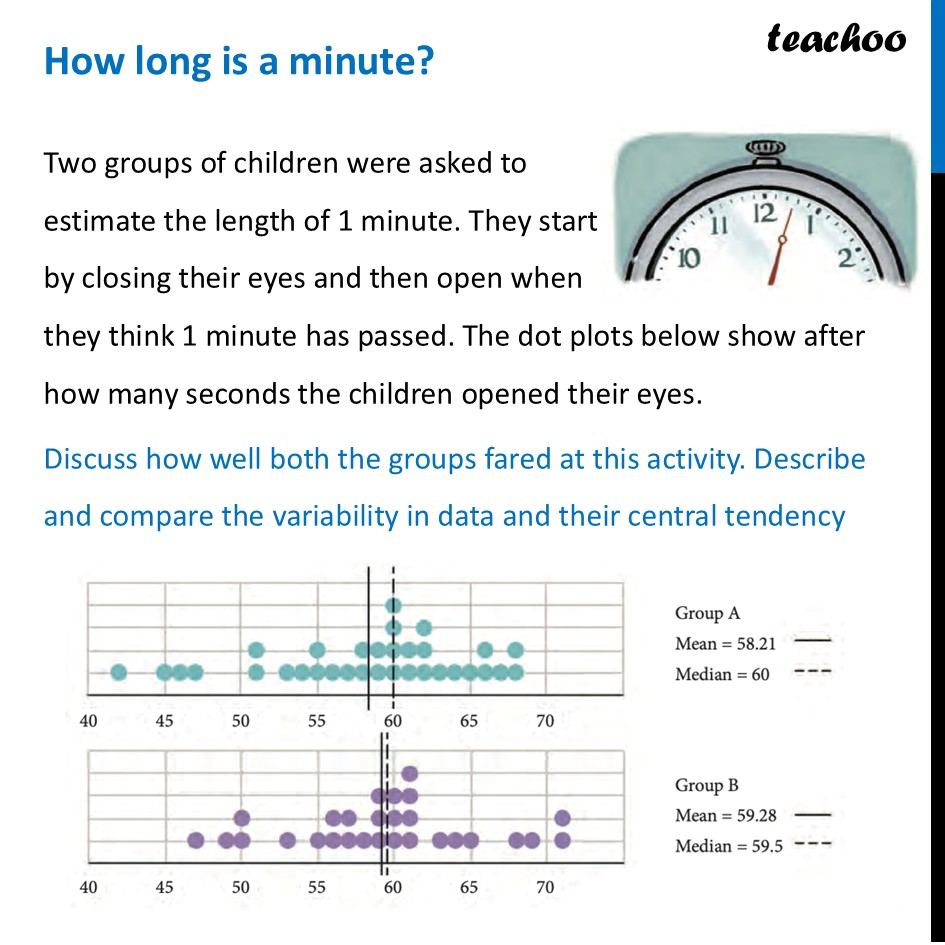
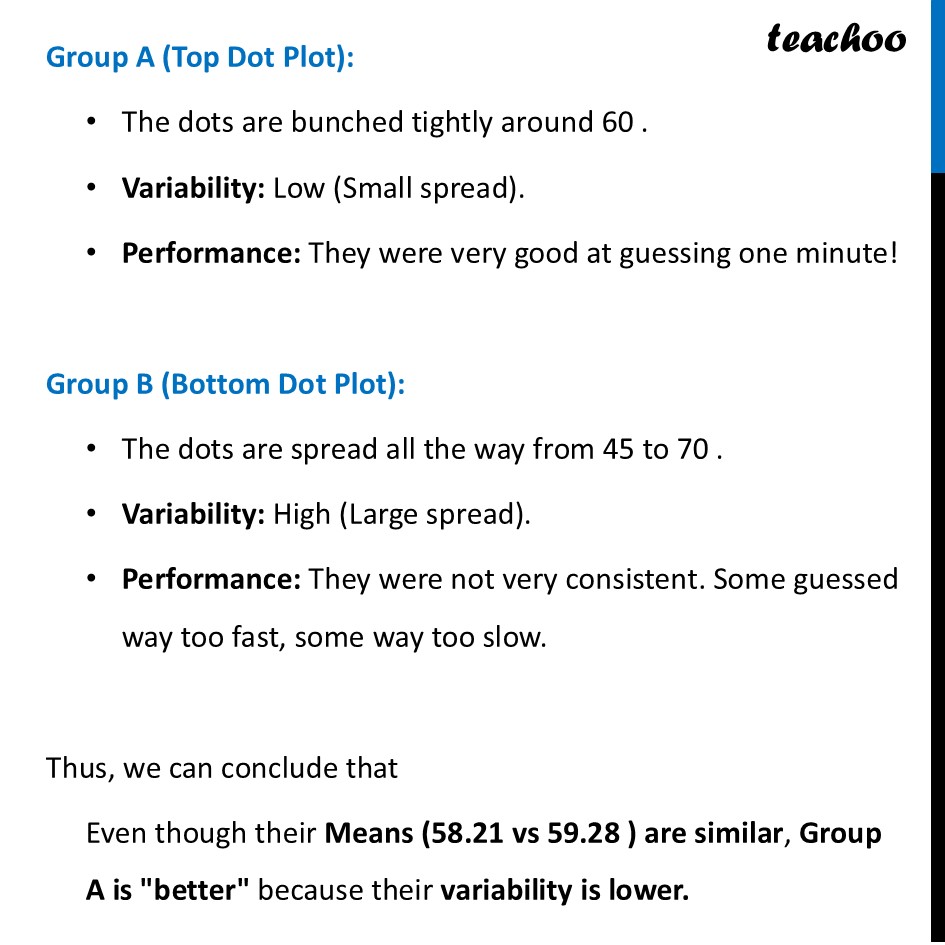
How long is a minute?Two groups of children were asked to estimate the length of 1 minute. They start by closing their eyes and then open when they think 1 minute has passed. The dot plots below show after how many seconds the children opened their eyes. Discuss how well both the groups fared at this activity. Describe and compare the variability in data and their central tendency Group A (Top Dot Plot): The dots are bunched tightly around 60 . Variability: Low (Small spread). Performance: They were very good at guessing one minute! Group B (Bottom Dot Plot): The dots are spread all the way from 45 to 70 . Variability: High (Large spread). Performance: They were not very consistent. Some guessed way too fast, some way too slow. Thus, we can conclude that Even though their Means (58.21 vs 59.28 ) are similar, Group A is "better" because their variability is lower.
