Variability in Statistics: Meaning, Uses and 3+Examples - Teachoo - Variability

part 2 - Variability (Statistics) - Variability - Chapter 5 Class 7 - Connecting the Dots... (Ganita Prakash II) - Class 7 (Ganita Prakash 1, 2 & old NCERT)
part 3 - Variability (Statistics) - Variability - Chapter 5 Class 7 - Connecting the Dots... (Ganita Prakash II) - Class 7 (Ganita Prakash 1, 2 & old NCERT) part 4 - Variability (Statistics) - Variability - Chapter 5 Class 7 - Connecting the Dots... (Ganita Prakash II) - Class 7 (Ganita Prakash 1, 2 & old NCERT) part 5 - Variability (Statistics) - Variability - Chapter 5 Class 7 - Connecting the Dots... (Ganita Prakash II) - Class 7 (Ganita Prakash 1, 2 & old NCERT)

Remove Ads Share on WhatsApp

Transcript

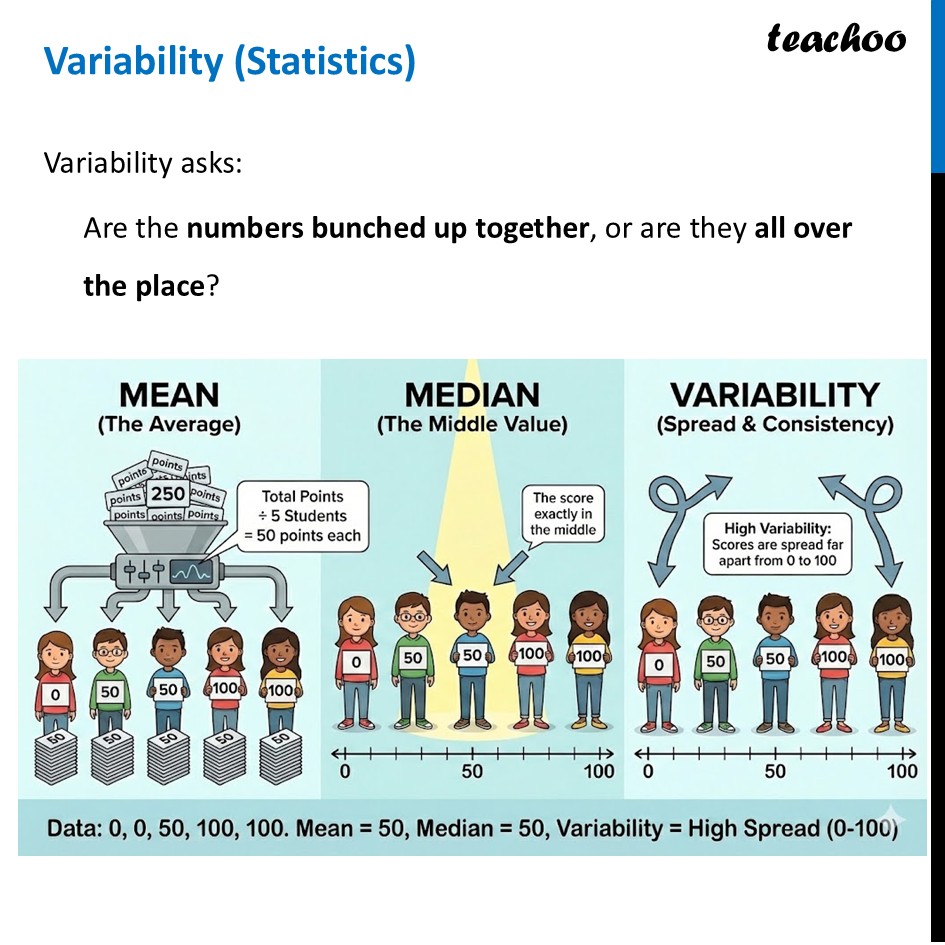
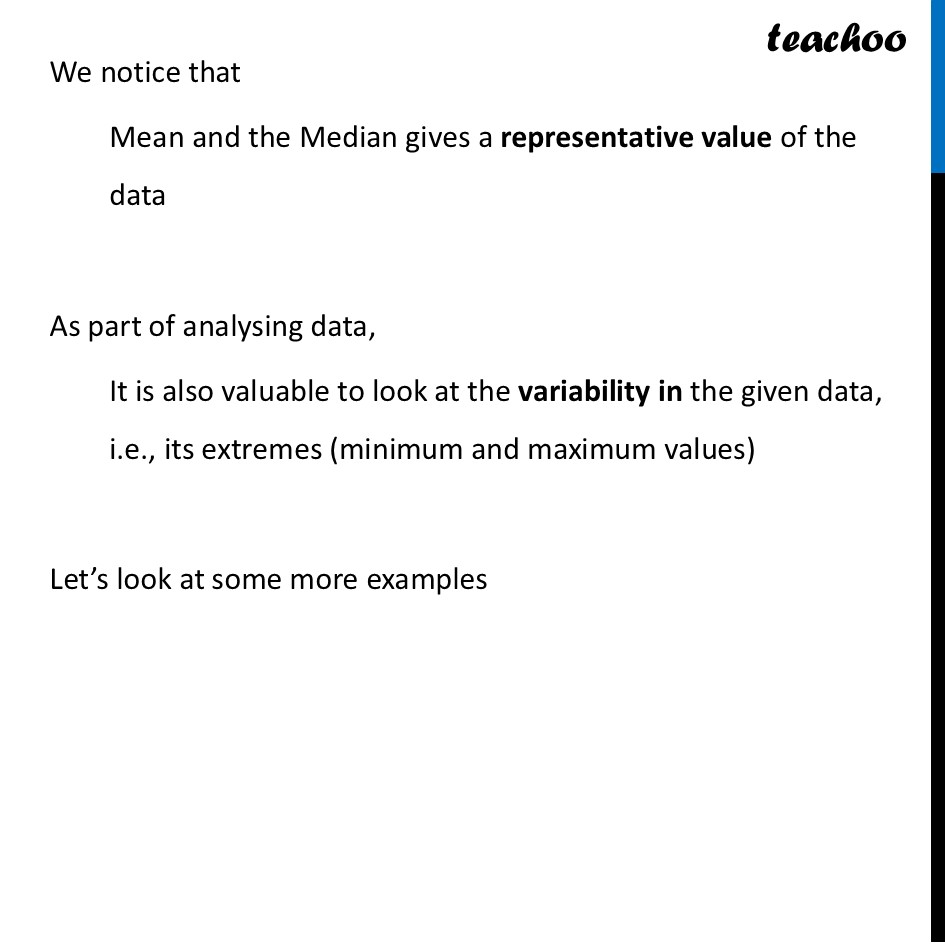
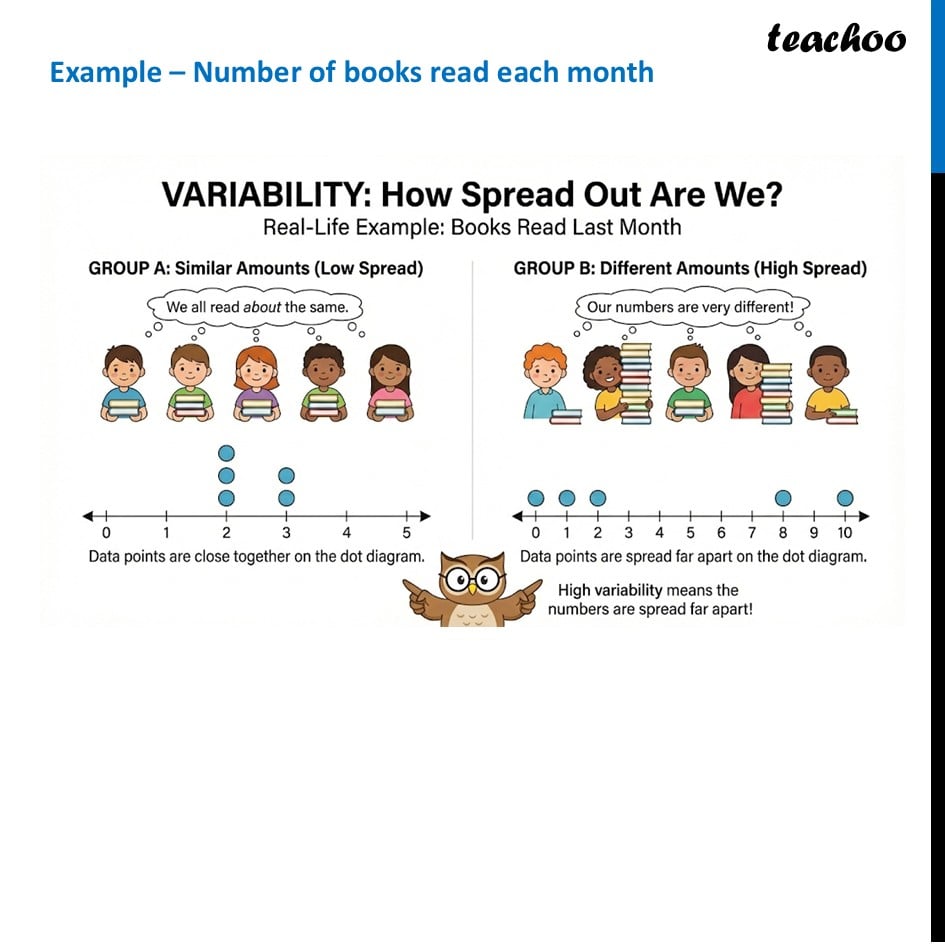
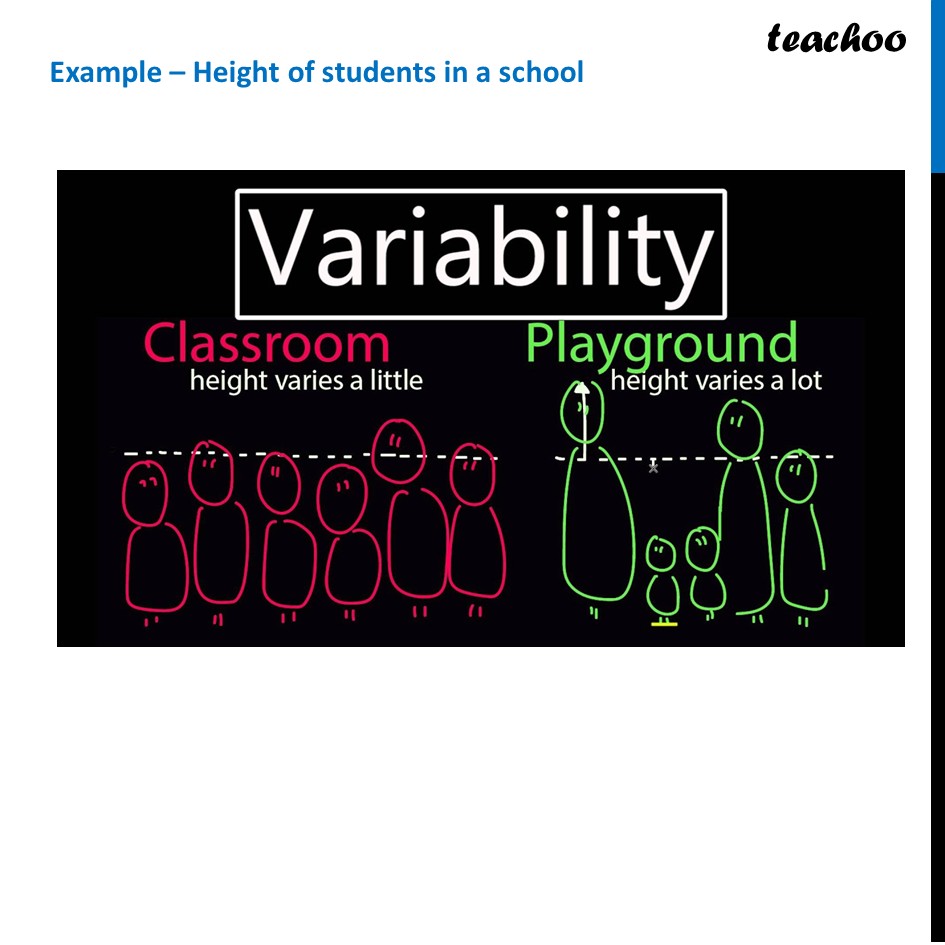
Variability (Statistics)Variability asks: Are the numbers bunched up together, or are they all over the place? We notice that Mean and the Median gives a representative value of the data As part of analysing data, It is also valuable to look at the variability in the given data, i.e., its extremes (minimum and maximum values) Let’s look at some more examples Example – Number of books read each month VARIABILITY: How Spread Out Are We? Real-Life Example: Books Read Last Month GROUP A: Similar Amounts (Low Spread) Data points are close together on the dot diagram. GROUP B: Different Amounts (High Spread) Data points are spread far apart on the dot diagram. High variability means the numbers are spread far apart!Example – Number of pencils in a class EASIER EXAMPLE: Variability = "How Spread Out?"Example – Height of students in a school

CA Maninder Singh's photo - Co-founder, Teachoo

Made by

CA Maninder Singh

CA Maninder Singh is a Chartered Accountant for the past 16 years. He also provides Accounts Tax GST Training in Delhi, Kerala and online.