Last updated at January 30, 2026 by Teachoo
Transcript
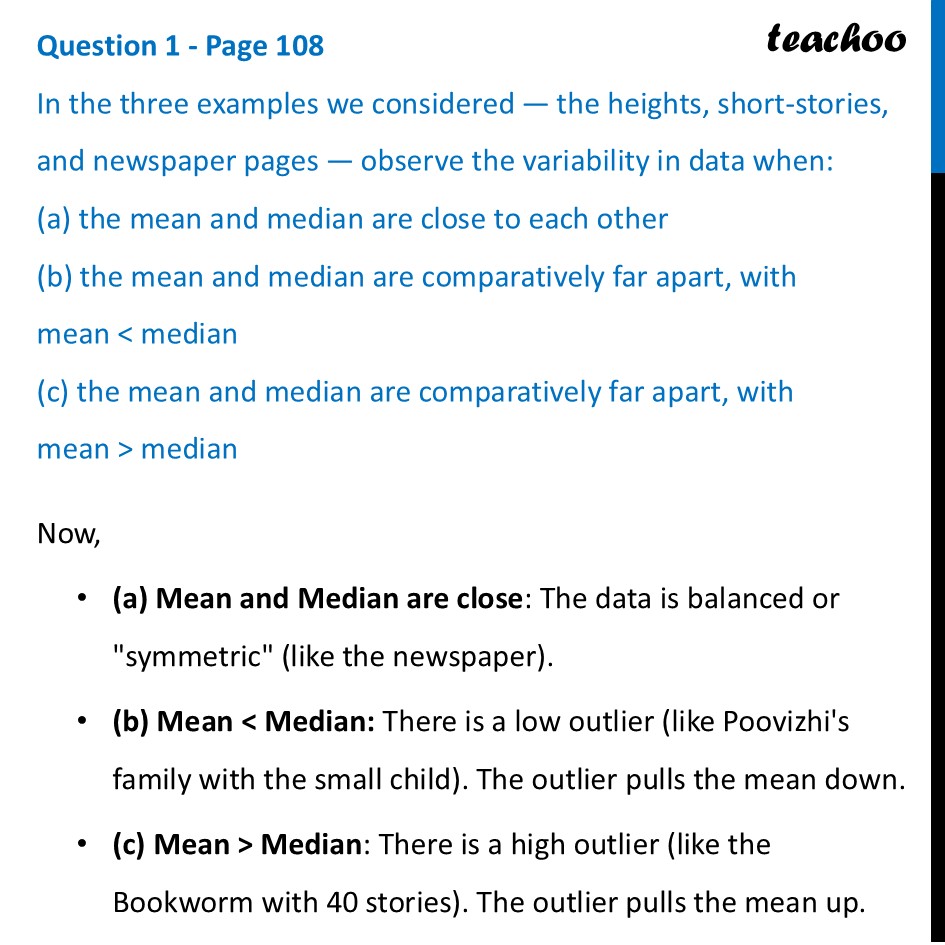
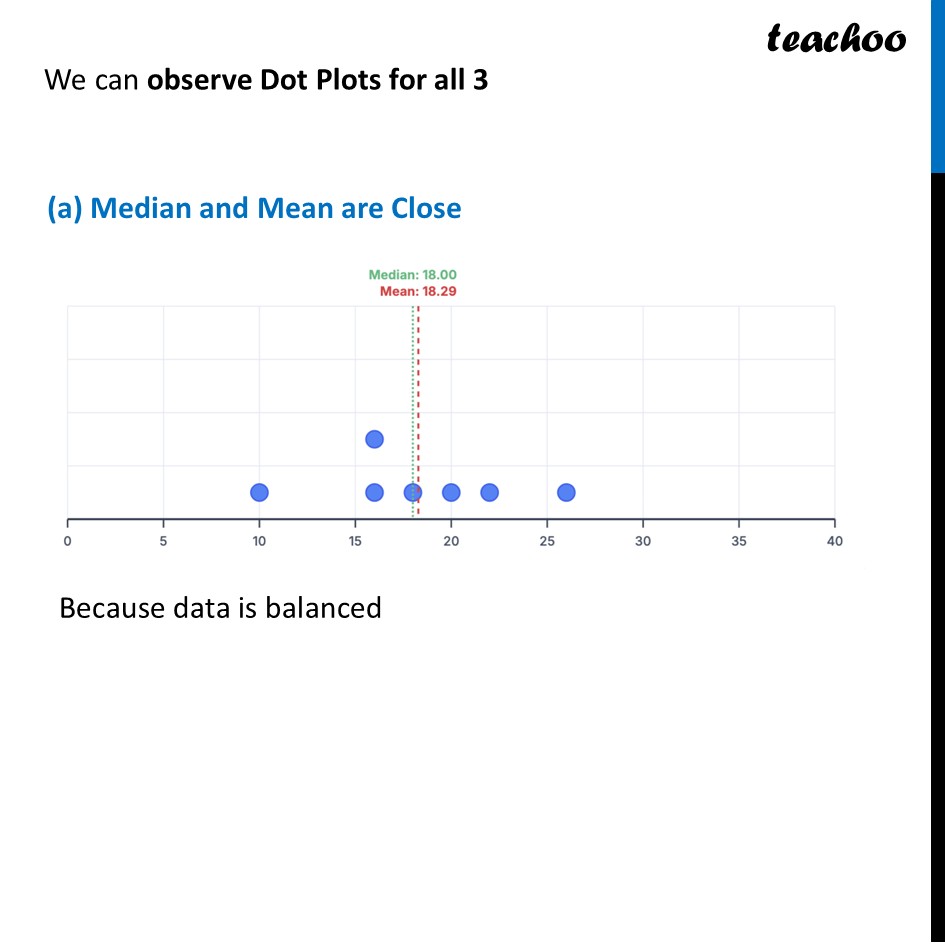
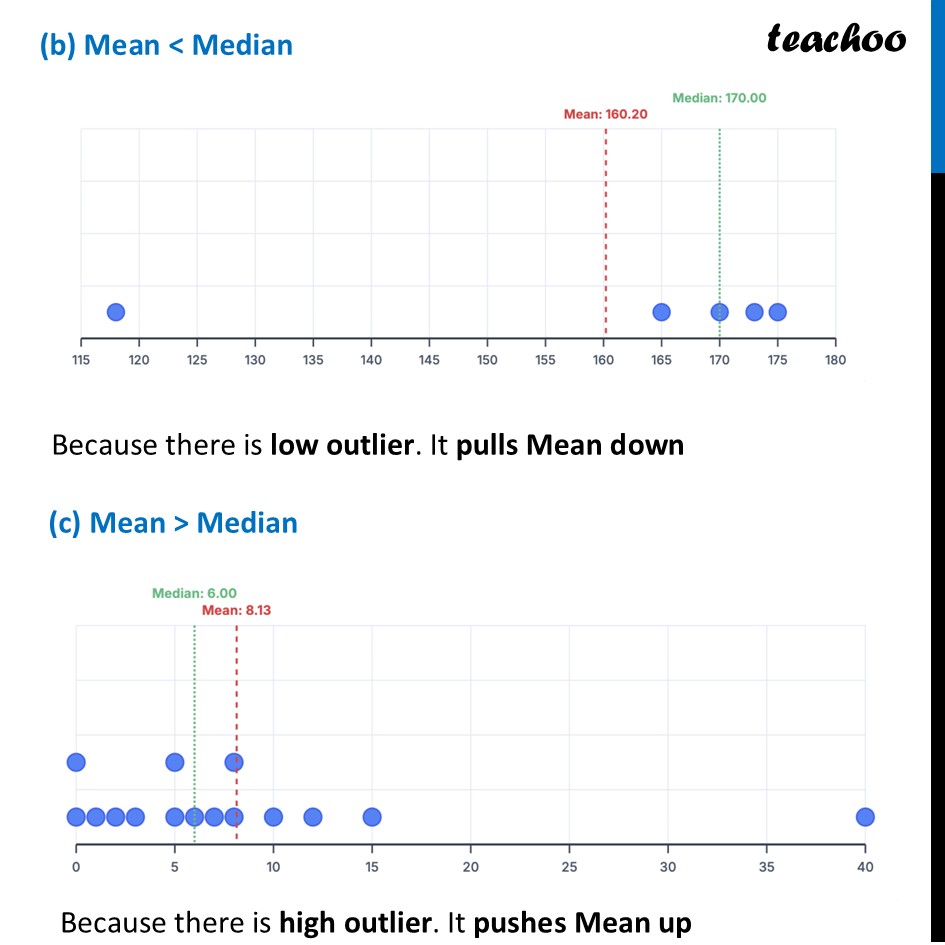
Question 1 - Page 108 In the three examples we considered — the heights, short-stories, and newspaper pages — observe the variability in data when: (a) the mean and median are close to each other (b) the mean and median are comparatively far apart, with mean < median (c) the mean and median are comparatively far apart, with mean > median Now, (a) Mean and Median are close: The data is balanced or "symmetric" (like the newspaper). (b) Mean < Median: There is a low outlier (like Poovizhi's family with the small child). The outlier pulls the mean down. (c) Mean > Median: There is a high outlier (like the Bookworm with 40 stories). The outlier pulls the mean up. We can observe Dot Plots for all 3 (a) Median and Mean are Close Because data is balanced (b) Mean < Median Because there is low outlier. It pulls Mean down (c) Mean > Median Because there is high outlier. It pushes Mean up
