What is an Infographic? Types and Explain [with Examples] - Teachoo - Infographics

part 2 - Infographics - Infographics - Chapter 4 Class 6 - Data Handling and Presentation (Ganita Prakash) - Class 6 (Ganita Prakash & Old NCERT)
part 3 - Infographics - Infographics - Chapter 4 Class 6 - Data Handling and Presentation (Ganita Prakash) - Class 6 (Ganita Prakash & Old NCERT)
part 4 - Infographics - Infographics - Chapter 4 Class 6 - Data Handling and Presentation (Ganita Prakash) - Class 6 (Ganita Prakash & Old NCERT)
part 5 - Infographics - Infographics - Chapter 4 Class 6 - Data Handling and Presentation (Ganita Prakash) - Class 6 (Ganita Prakash & Old NCERT)

Remove Ads

Transcript

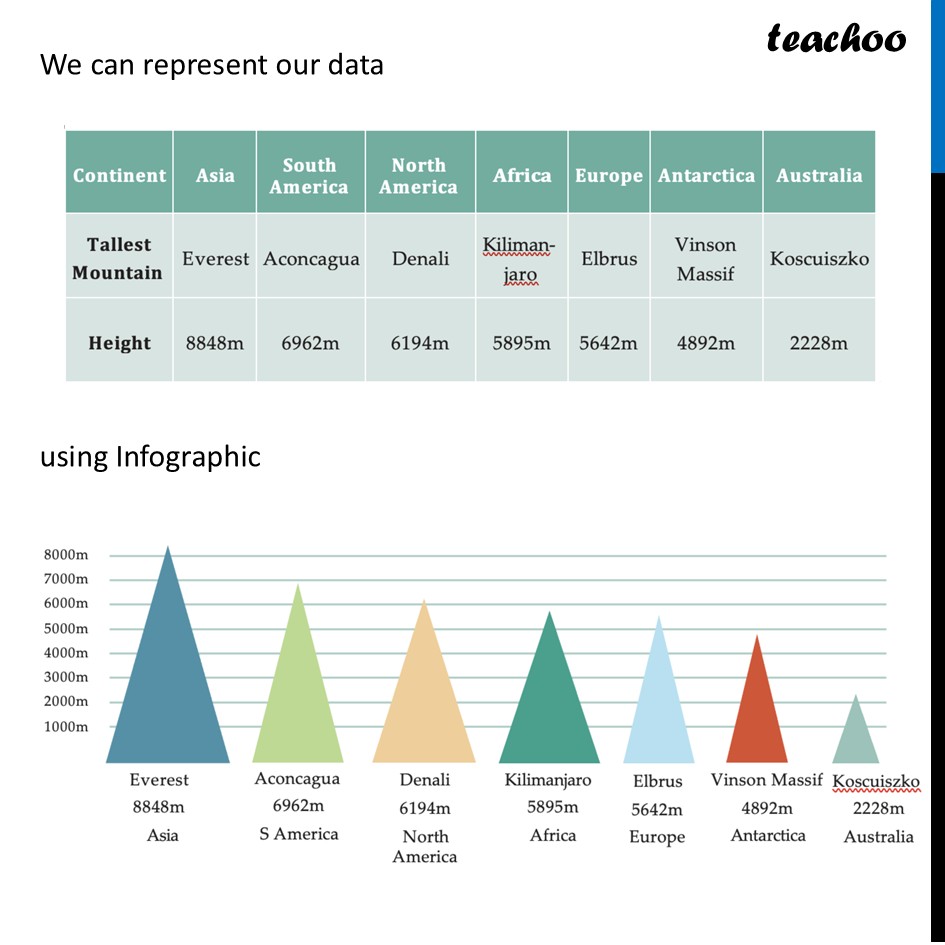
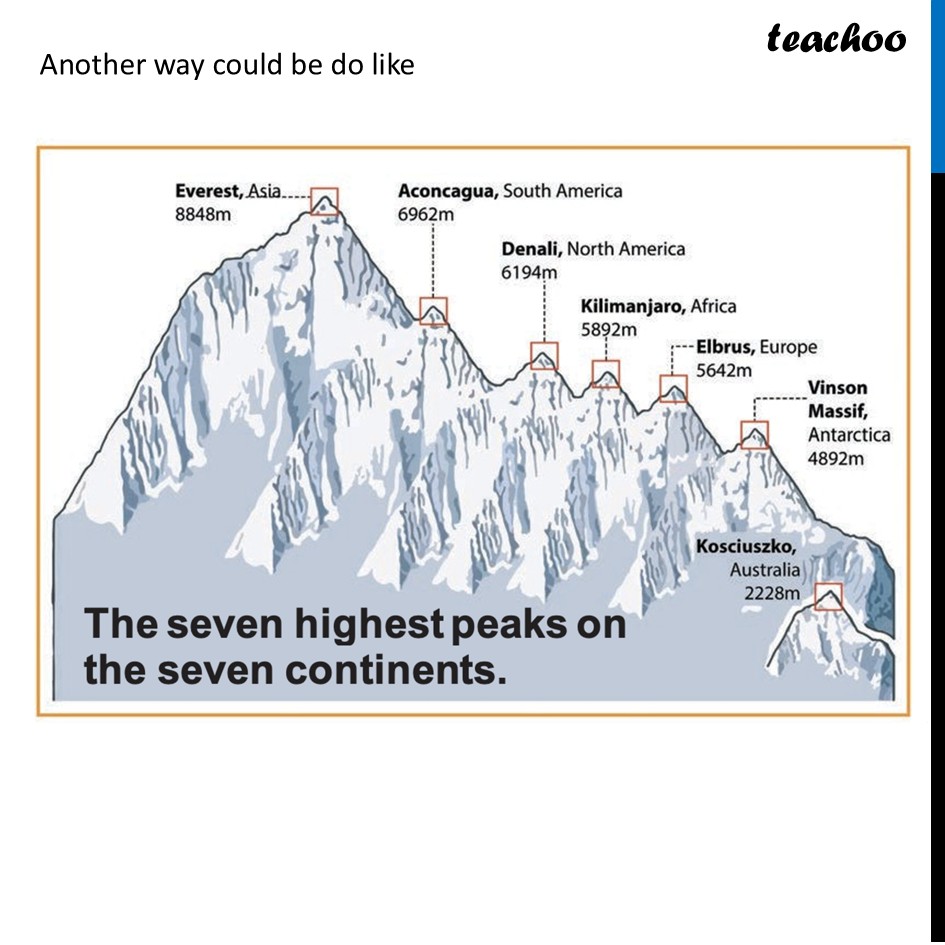
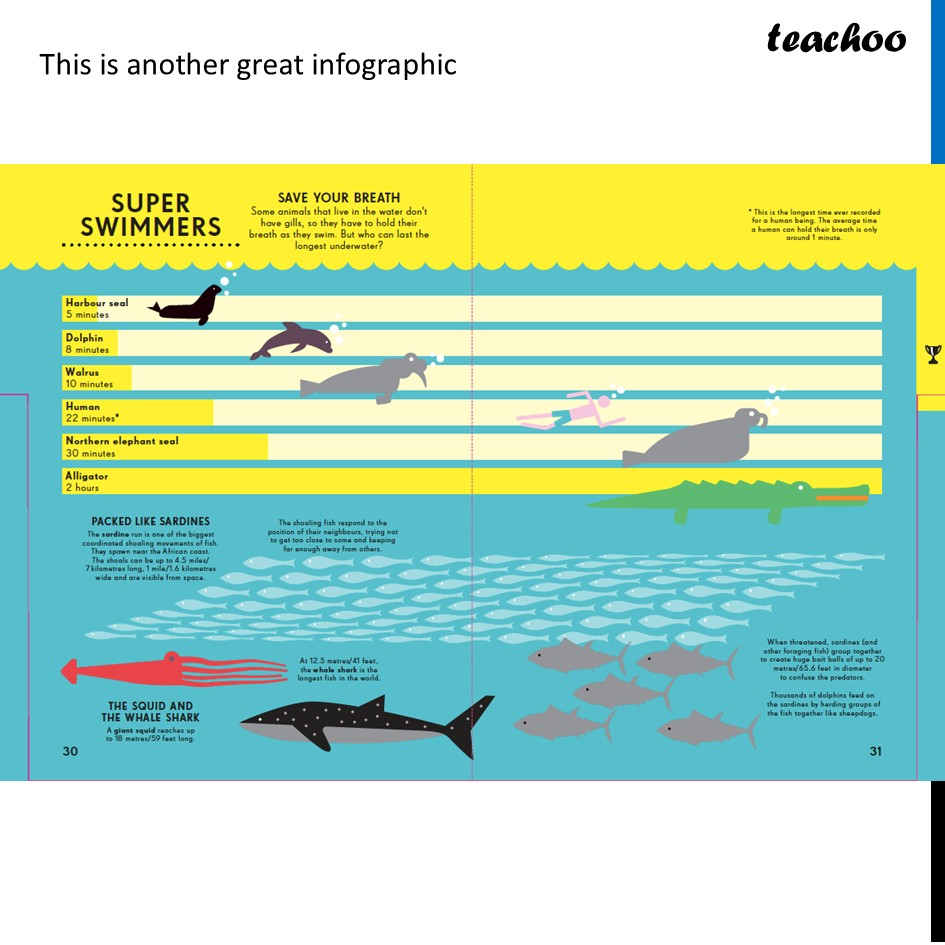
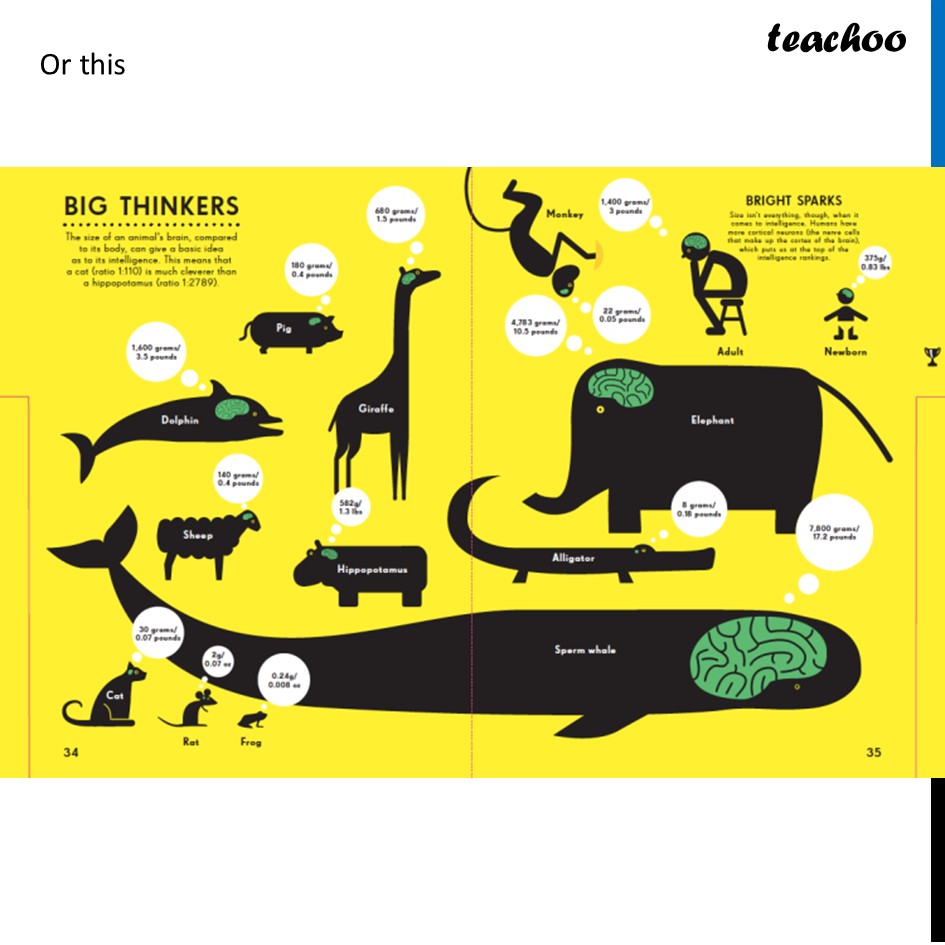
Infographics When data visualisations such as bar graphs are further beautified with more extensive artistic and visual imagery, they are called information graphics or infographics for short The aim of infographics is to make use of attention-attracting and engaging visuals to communicate information even more clearly and quickly, in a visually pleasing way. For example We can represent our data Another way could be do like This is another great infographic Or this using Infographic

Davneet Singh's photo - Co-founder, Teachoo

Made by

Davneet Singh

Davneet Singh has done his B.Tech from Indian Institute of Technology, Kanpur. He has been teaching from the past 15 years. He provides courses for Maths, Science and Computer Science at Teachoo