Last updated at June 23, 2025 by Teachoo
Transcript
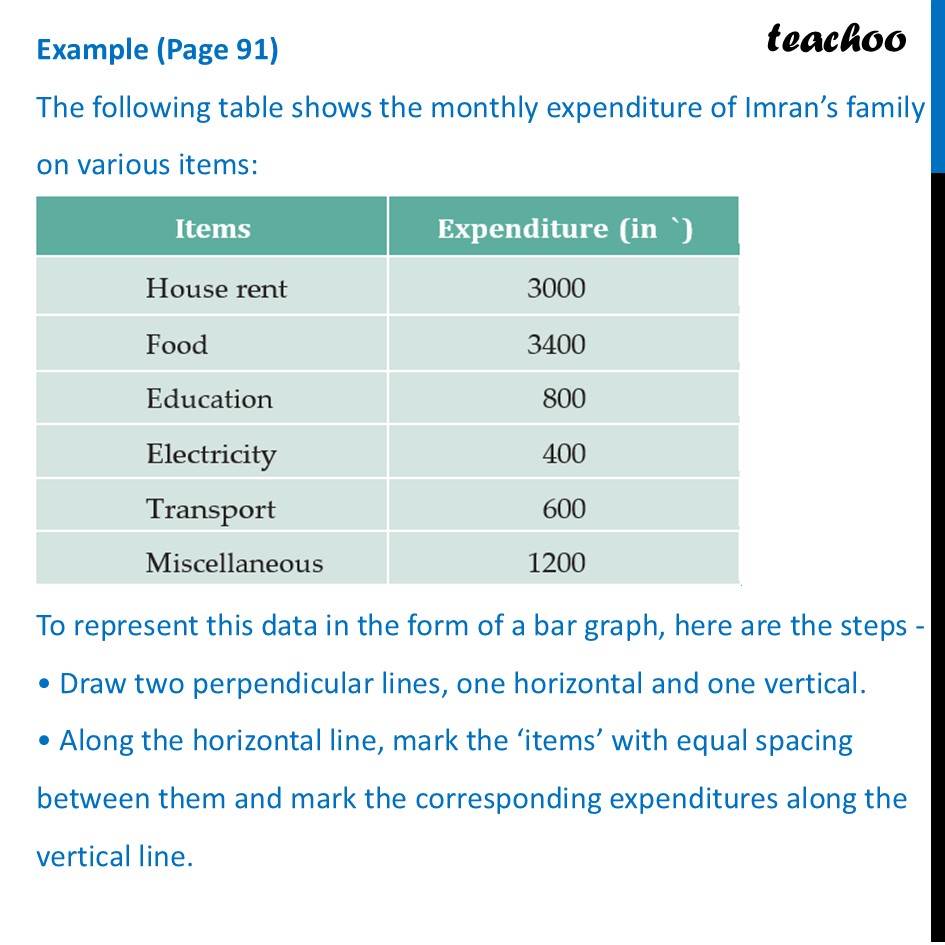
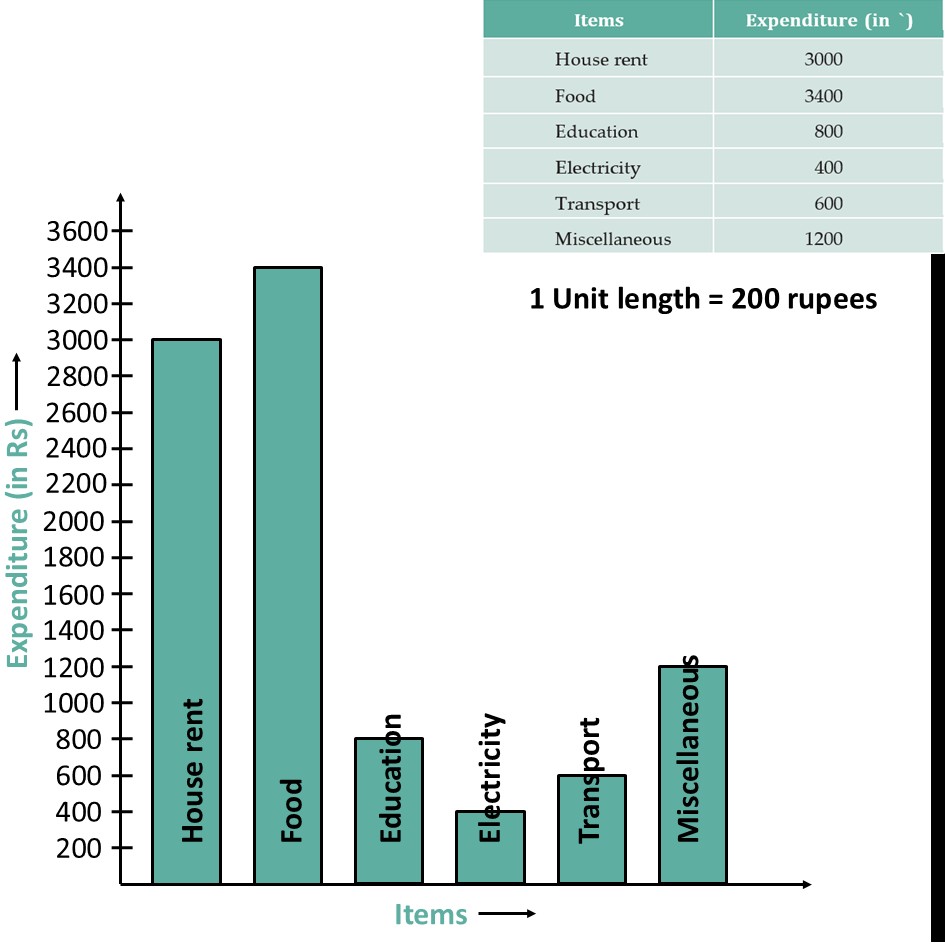
Example (Page 91) The following table shows the monthly expenditure of Imran’s family on various items: To represent this data in the form of a bar graph, here are the steps - • Draw two perpendicular lines, one horizontal and one vertical. • Along the horizontal line, mark the ‘items’ with equal spacing between them and mark the corresponding expenditures along the vertical line.• Take bars of the same width, keeping a uniform gap between them. • Choose a suitable scale along the vertical line. Let, 1 unit length = ₹ 200, and then mark and write the corresponding values (₹200, ₹400, etc.) representing each unit length.Alright, the steps to make the graph is already given - let’s make it! Expenditure (in Rs) 1 Unit length = 200 rupees
