![Drawing Bar Graph - Examples [with Practice questions] - Teachoo - Drawing Bar Graph](https://cdn.teachoo.com/cdcb6ab3-9374-4854-a54e-b592afdf490b/slide19.jpg)
Last updated at June 23, 2025 by Teachoo
Transcript
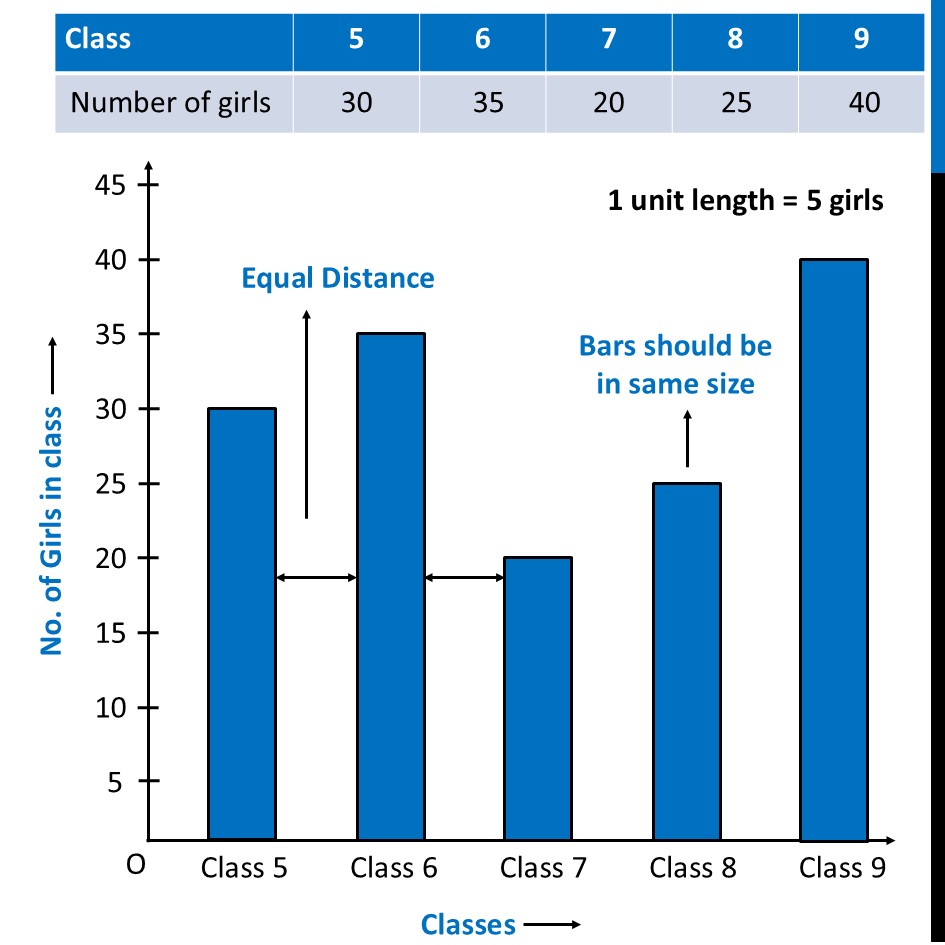
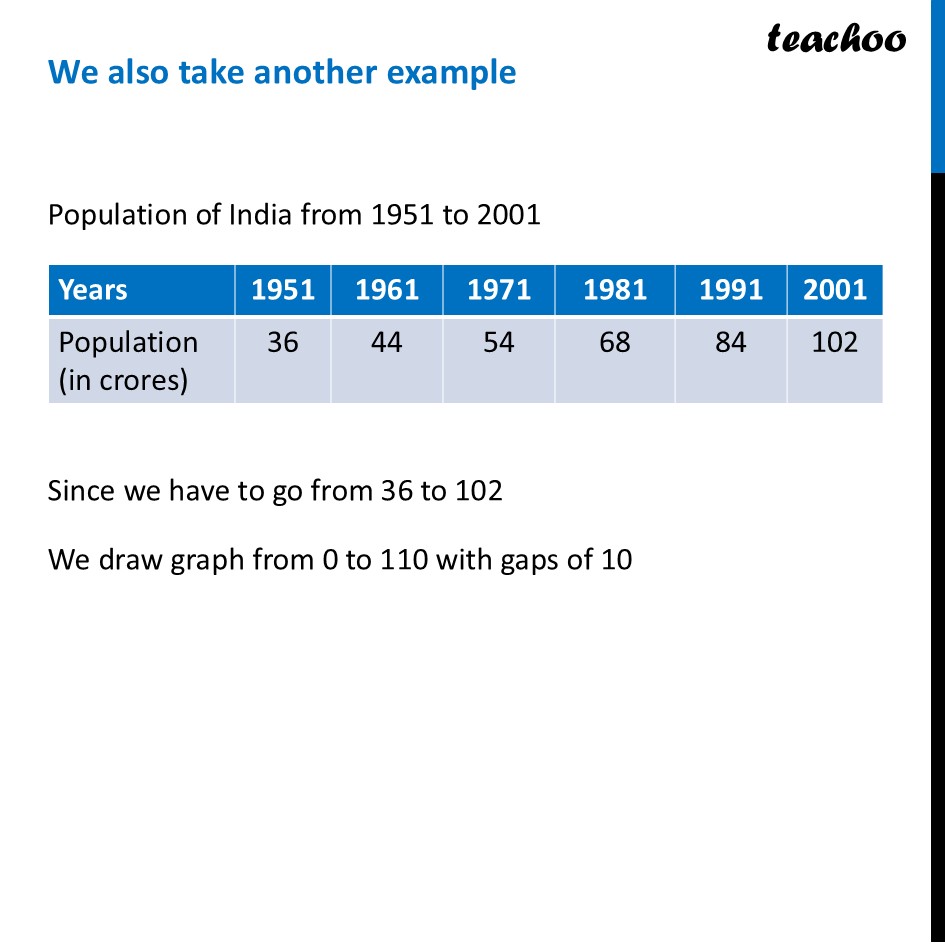
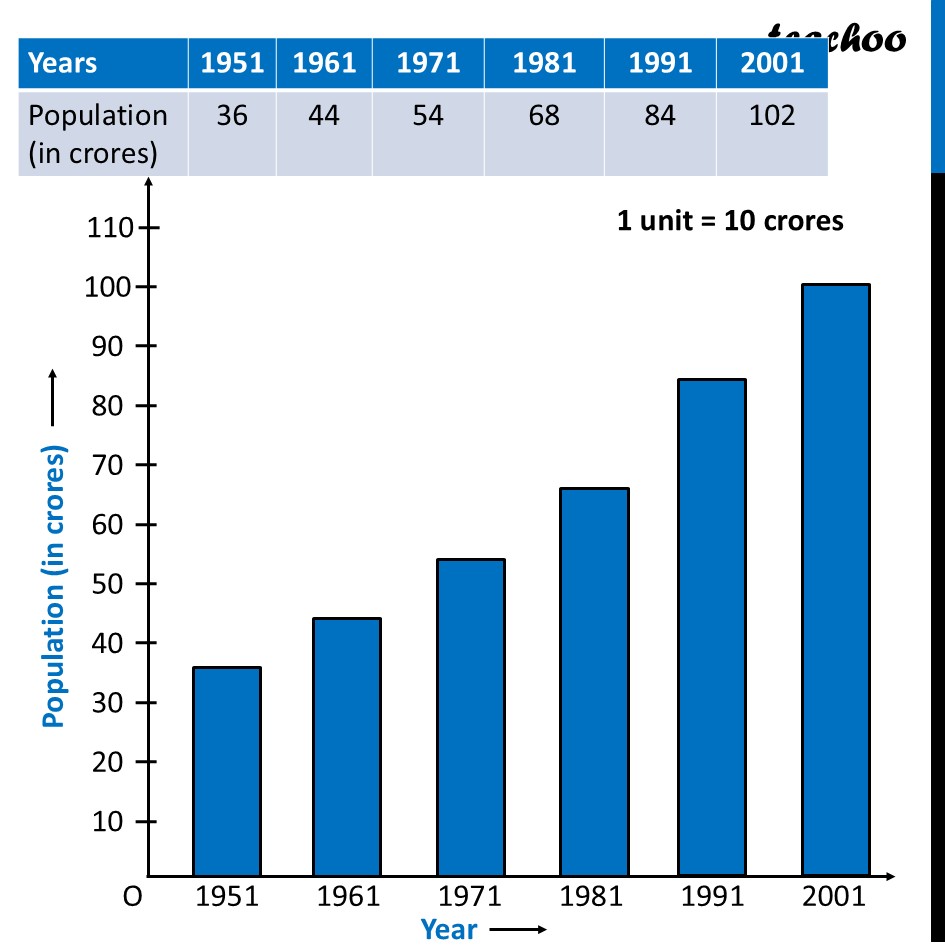
Drawing Bar GraphSuppose we have data of Number of girls in class 5 to 9 We draw a bar graph using these steps We draw horizontal and vertical line In horizontal line, we write class number In vertical line, we write Number of girls We choose a scale – here 1 unit = 1 girl Then, we draw a bar graph, with distance between horizontal labelling Equal Distance Bars should be in same size No. of Girls in class Classes We also take another example Population of India from 1951 to 2001 Since we have to go from 36 to 102 We draw graph from 0 to 110 with gaps of 10 Population (in crores) Year
