Last updated at June 23, 2025 by Teachoo
Transcript
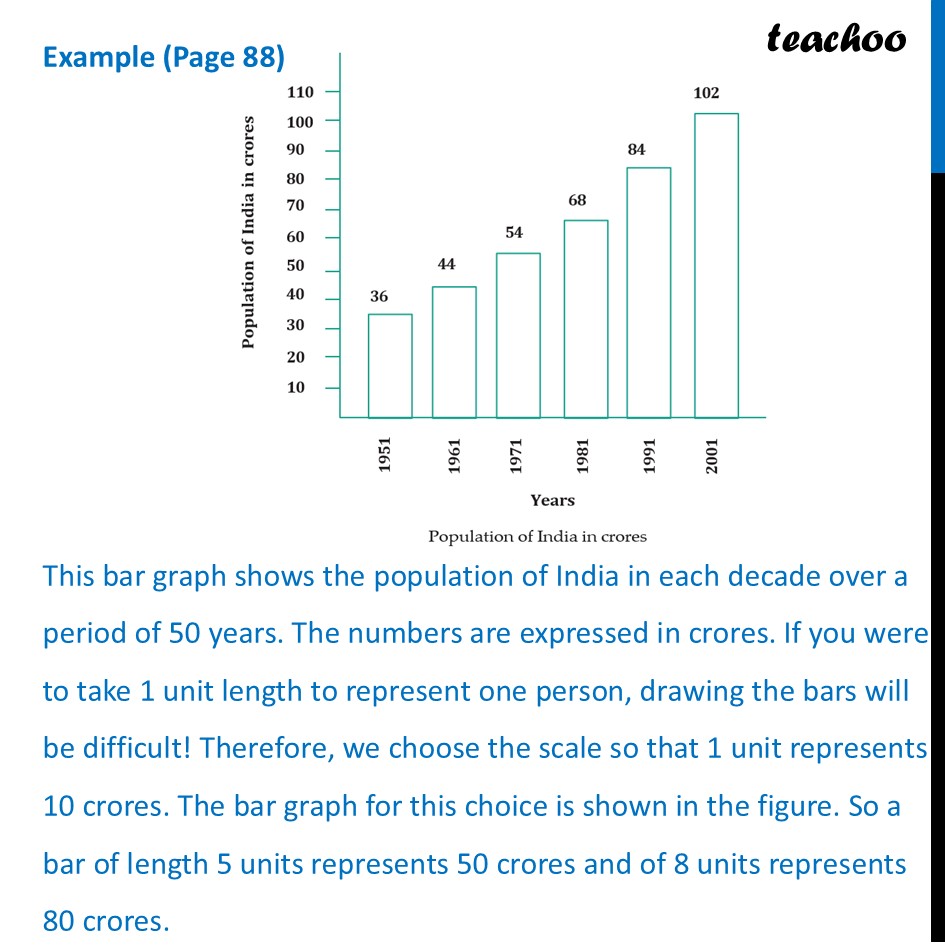
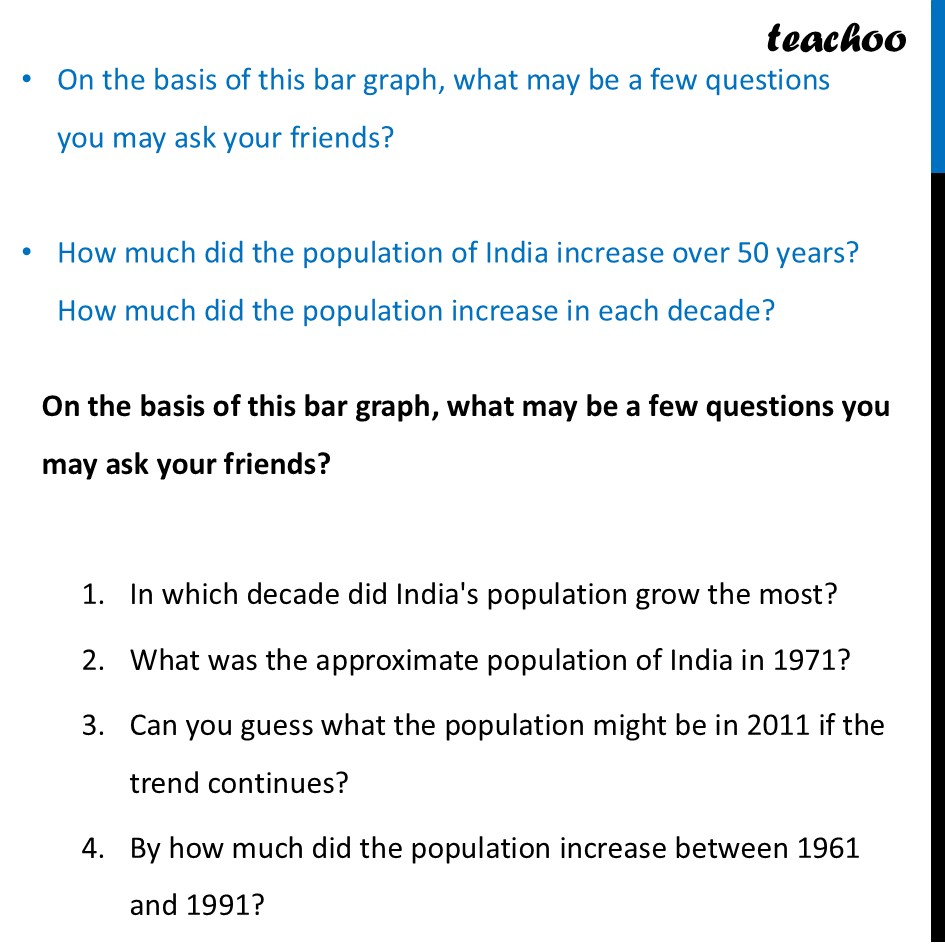
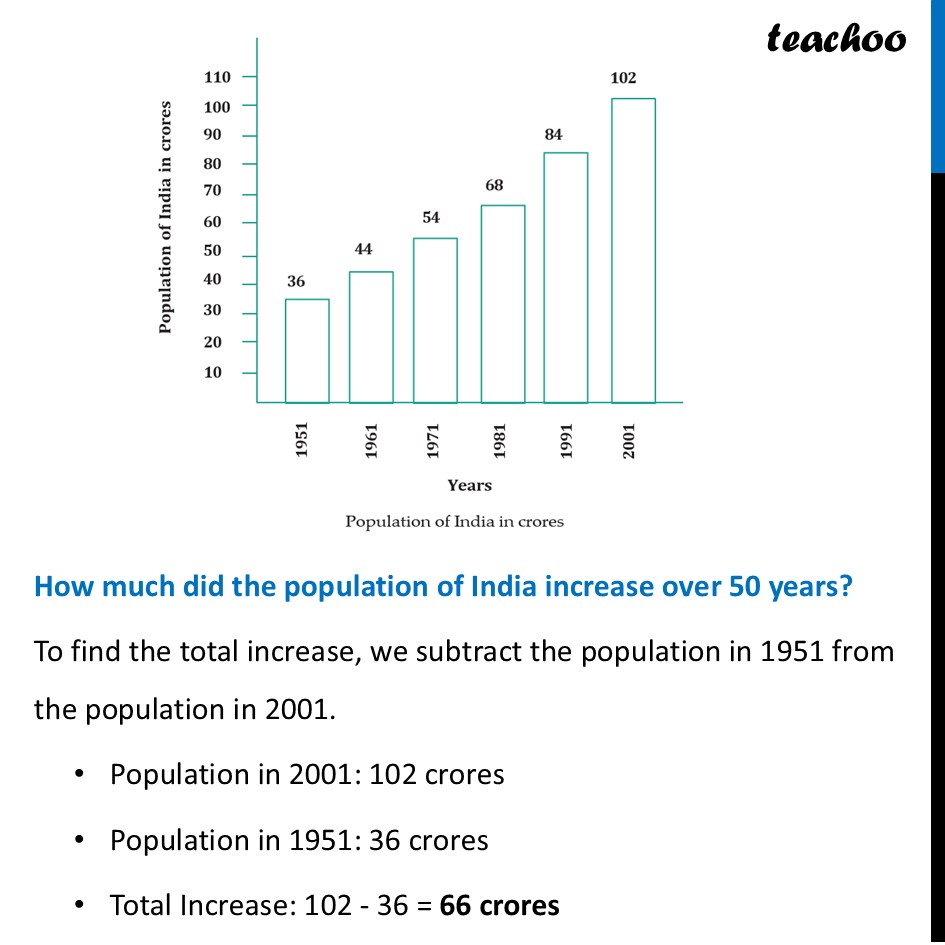
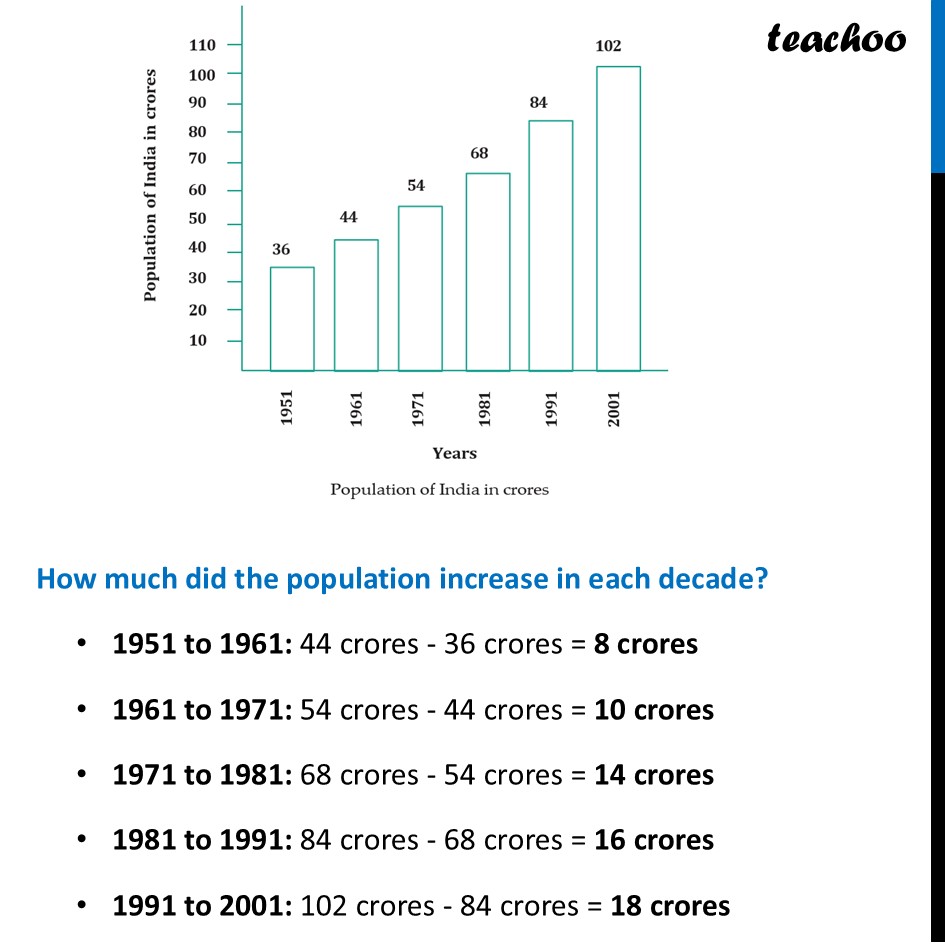
Example (Page 88) This bar graph shows the population of India in each decade over a period of 50 years. The numbers are expressed in crores. If you were to take 1 unit length to represent one person, drawing the bars will be difficult! Therefore, we choose the scale so that 1 unit represents 10 crores. The bar graph for this choice is shown in the figure. So a bar of length 5 units represents 50 crores and of 8 units represents 80 crores. On the basis of this bar graph, what may be a few questions you may ask your friends? How much did the population of India increase over 50 years? How much did the population increase in each decade? On the basis of this bar graph, what may be a few questions you may ask your friends? In which decade did India's population grow the most? What was the approximate population of India in 1971? Can you guess what the population might be in 2011 if the trend continues? By how much did the population increase between 1961 and 1991? How much did the population of India increase over 50 years? To find the total increase, we subtract the population in 1951 from the population in 2001. Population in 2001: 102 crores Population in 1951: 36 crores Total Increase: 102 - 36 = 66 crores How much did the population increase in each decade? 1951 to 1961: 44 crores - 36 crores = 8 crores 1961 to 1971: 54 crores - 44 crores = 10 crores 1971 to 1981: 68 crores - 54 crores = 14 crores 1981 to 1991: 84 crores - 68 crores = 16 crores 1991 to 2001: 102 crores - 84 crores = 18 crores
