![Bar Graph - Worksheet, Examples [with Practice questions] - Teachoo - Bar Graph](https://cdn.teachoo.com/2b66ba5b-7645-4012-a5f2-ac2e97736a6e/slide3.jpg)
Last updated at June 23, 2025 by Teachoo
Transcript
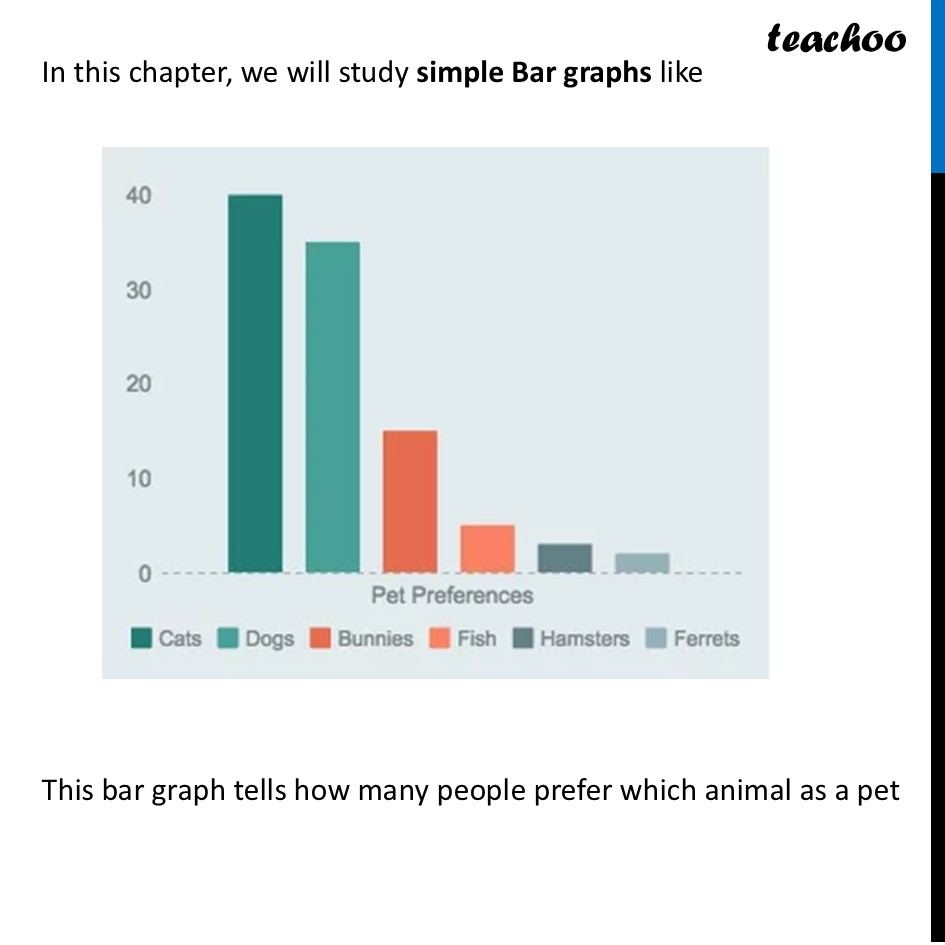
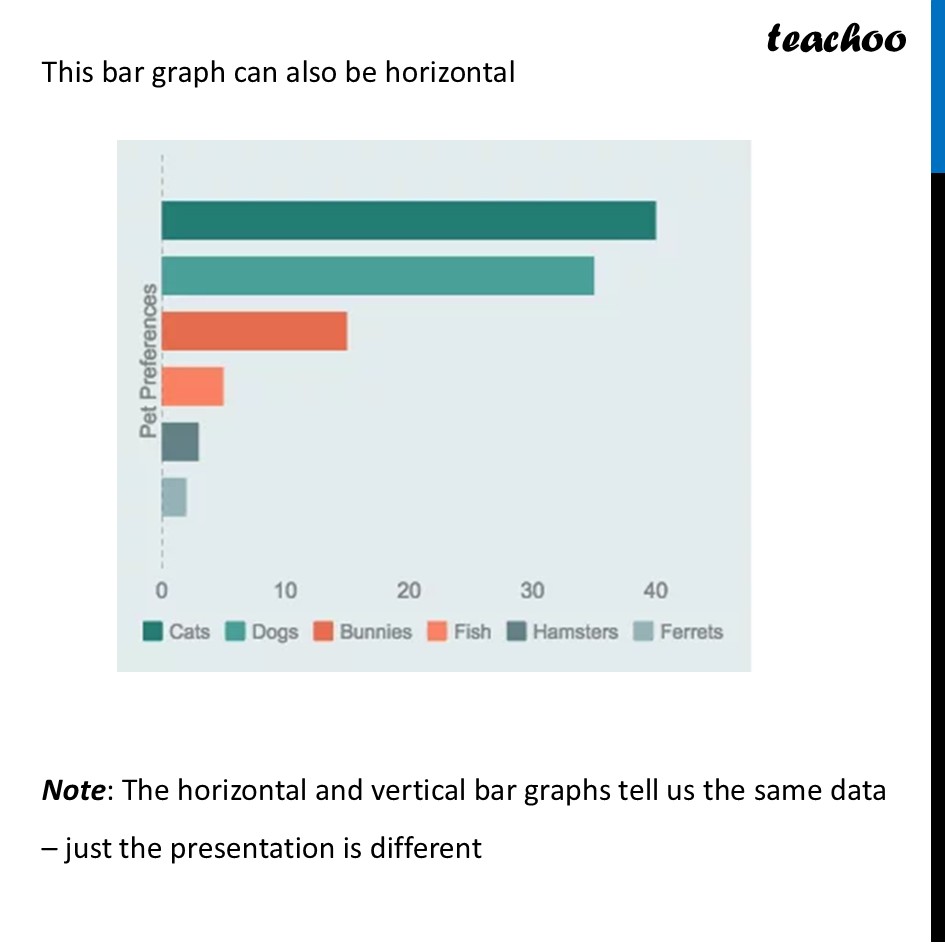
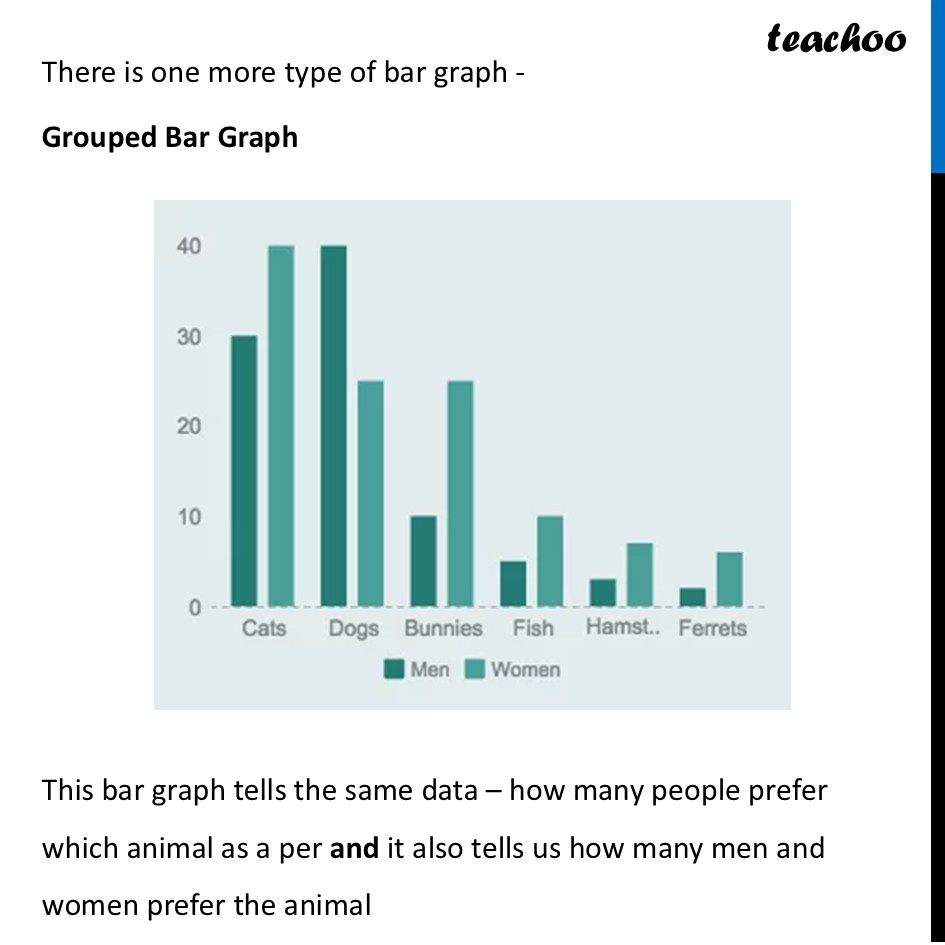
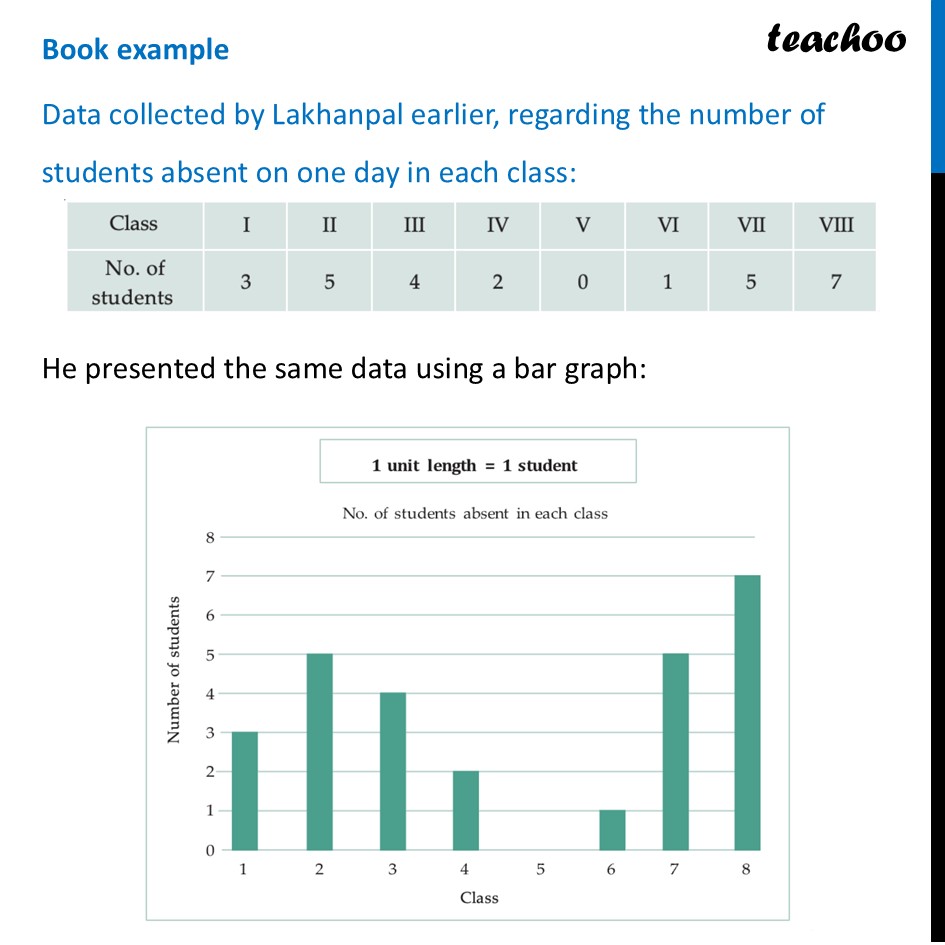
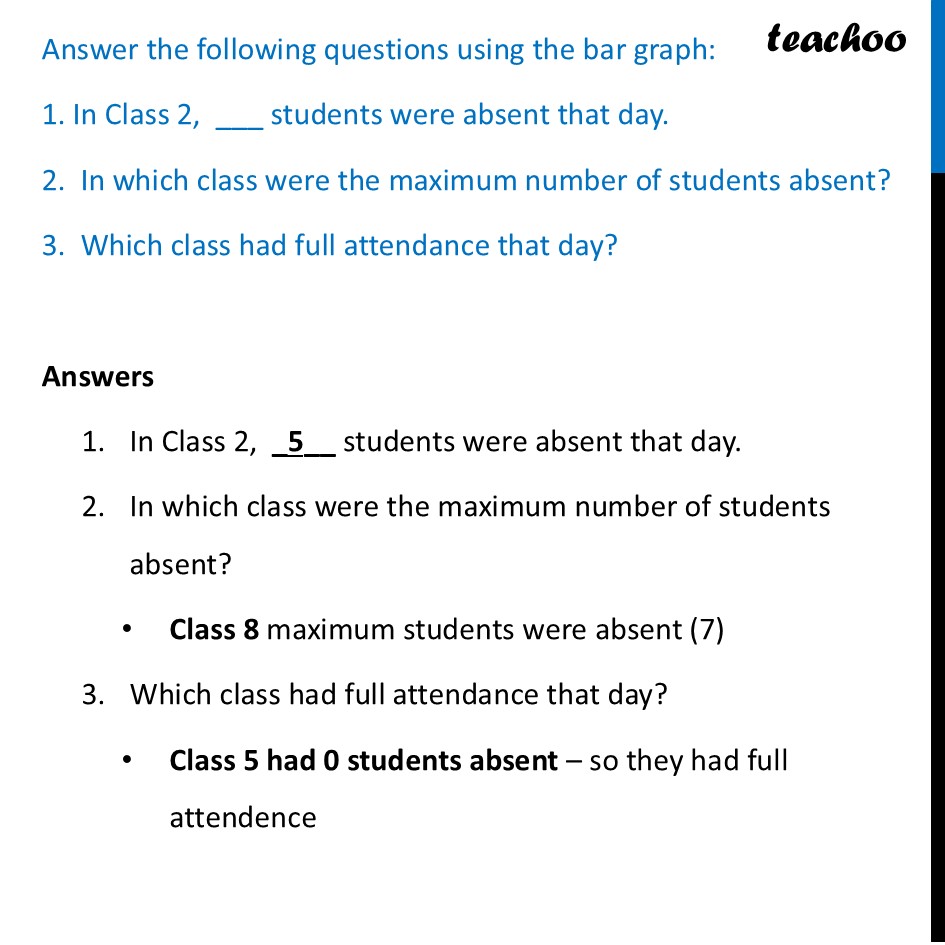
Bar Graph Bar graphs look like Like pictographs, such bar graphs can help us to quickly understand and interpret information, such as the highest value, the comparison of values of different categories, etc In this chapter, we will study simple Bar graphs like This bar graph can also be horizontal Note: The horizontal and vertical bar graphs tell us the same data – just the presentation is different There is one more type of bar graph - Grouped Bar Graph This bar graph tells the same data – how many people prefer which animal as a per and it also tells us how many men and women prefer the animal Book example Data collected by Lakhanpal earlier, regarding the number of students absent on one day in each class: He presented the same data using a bar graph: Answer the following questions using the bar graph: 1. In Class 2, ___ students were absent that day. 2. In which class were the maximum number of students absent? 3. Which class had full attendance that day? Answers In Class 2, _5__ students were absent that day. In which class were the maximum number of students absent? Class 8 maximum students were absent (7) Which class had full attendance that day? Class 5 had 0 students absent – so they had full attendence This bar graph tells how many people prefer which animal as a pet
