![Pictograph - Definition, Example [with Interesting example] - Teachoo - Pictograph](https://cdn.teachoo.com/c0b6525c-8eea-40e9-aa3b-298b8ee58652/slide47.jpg)


Last updated at June 23, 2025 by Teachoo
Transcript
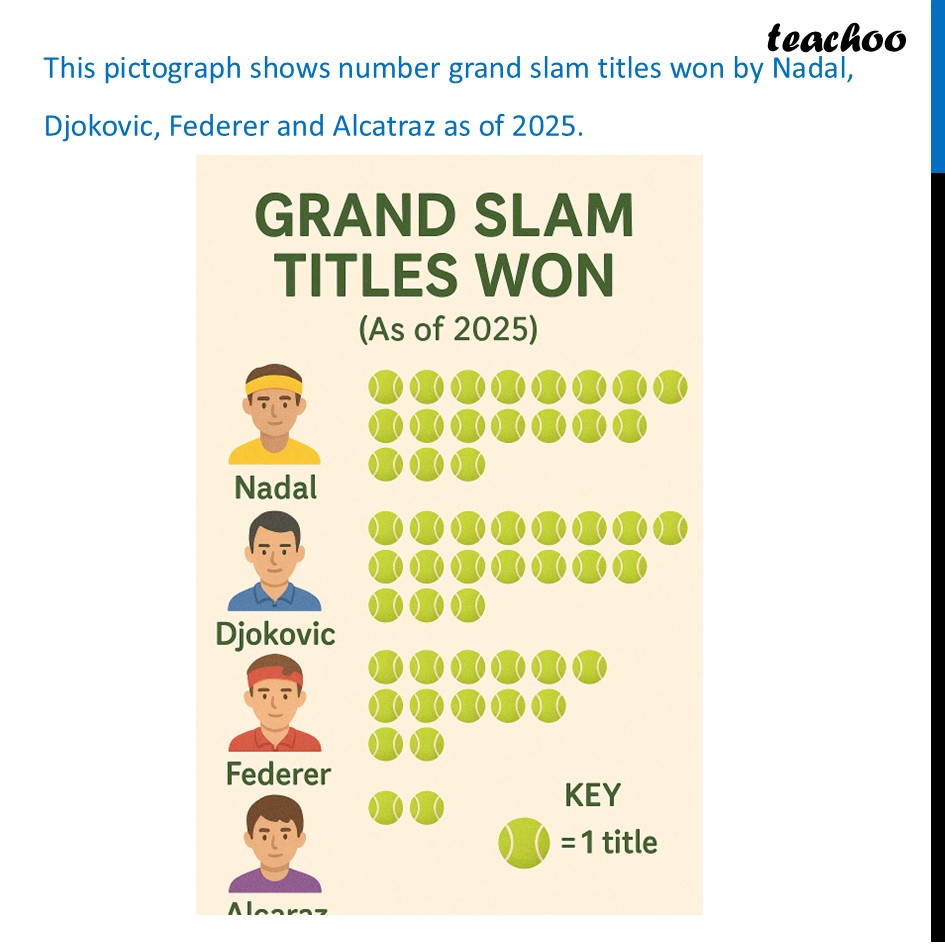
PictographIn a pictograph, we represent data using pictures Here, each image represents a number Example – Here is Number of bulbs purchased by Lalit hotel in 2025 Note that each picture of a bulb means 10 bulbs (and the half-apple picture means 5 bulbs). So the pictograph is showing: In January - 20 bulbs were bought In February - 25 bulbs were bought In March - 45 bulbs were bought In April - 10 bulbs were bought Let’s look at another example – which is more interesting This pictograph shows number grand slam titles won by Nadal, Djokovic, Federer and Alcatraz as of 2025. Can you tell me who won the most number of grand slams from the pictograph above?
