
Last updated at April 27, 2026 by Teachoo
Transcript
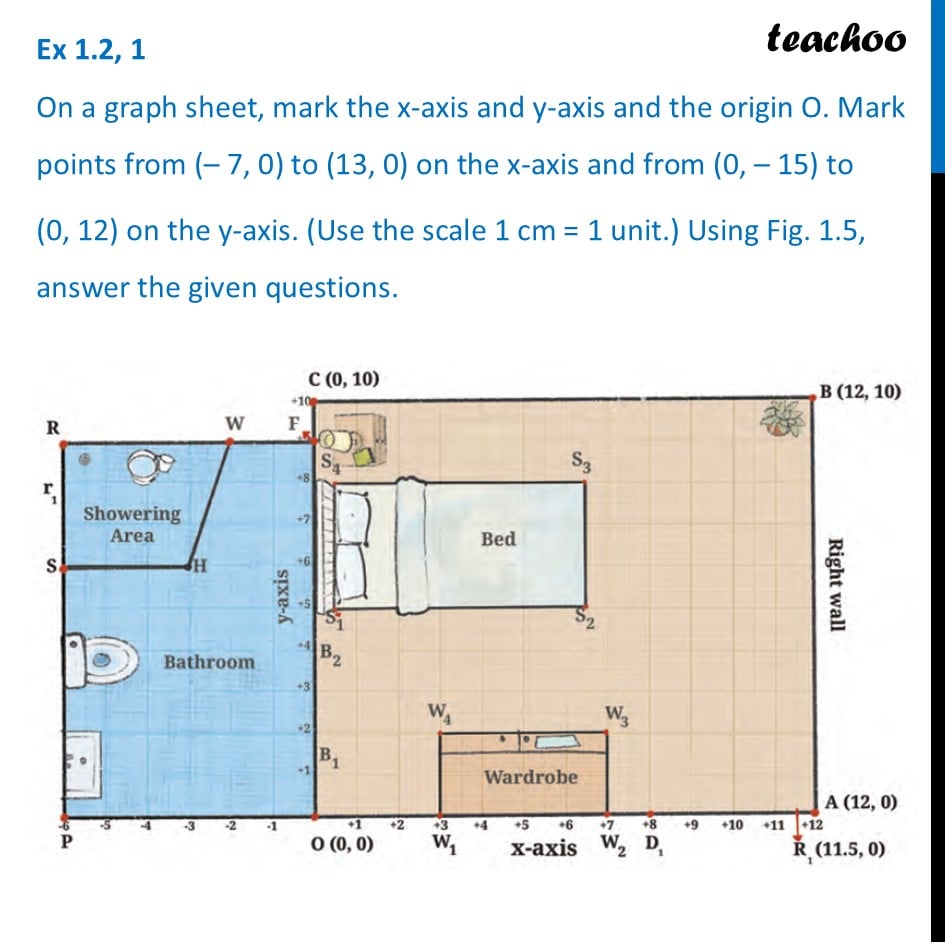
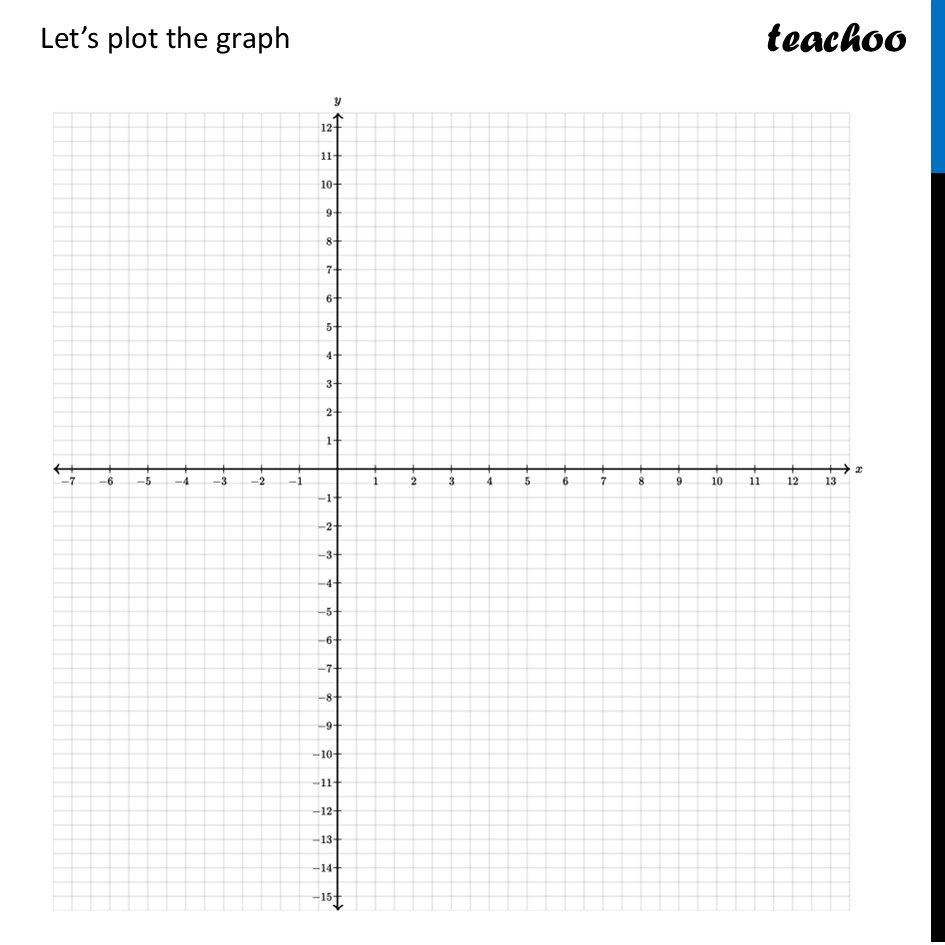
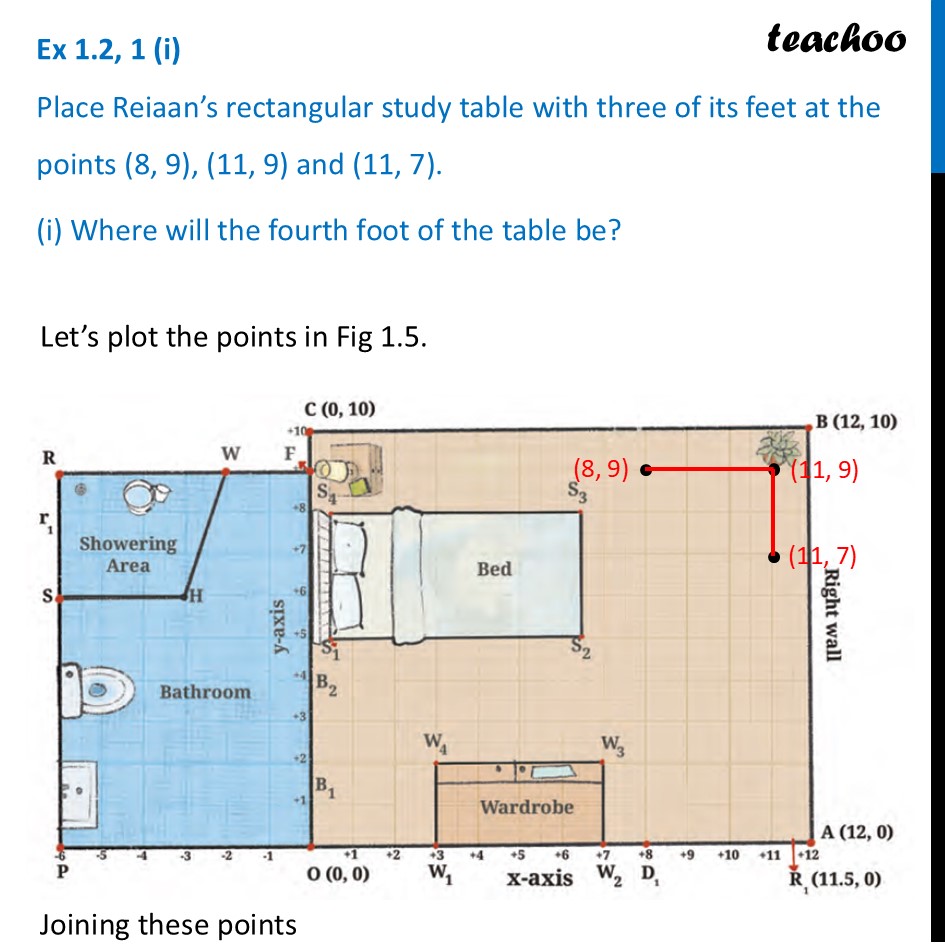
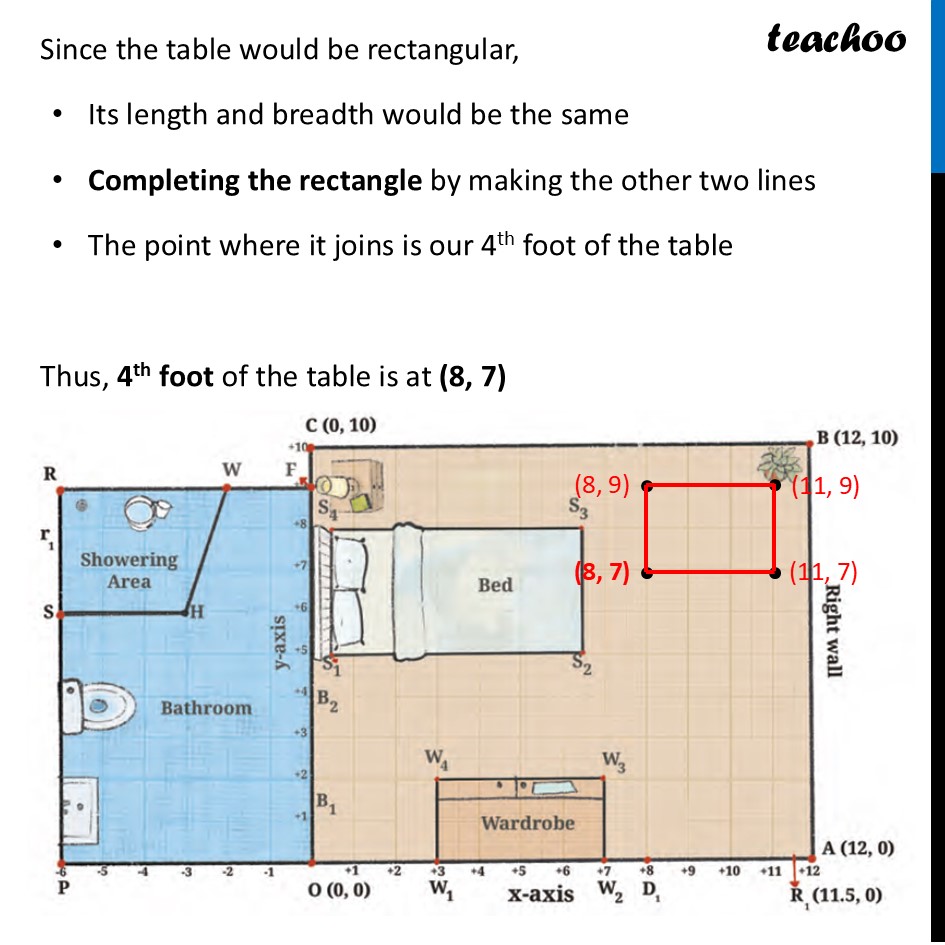
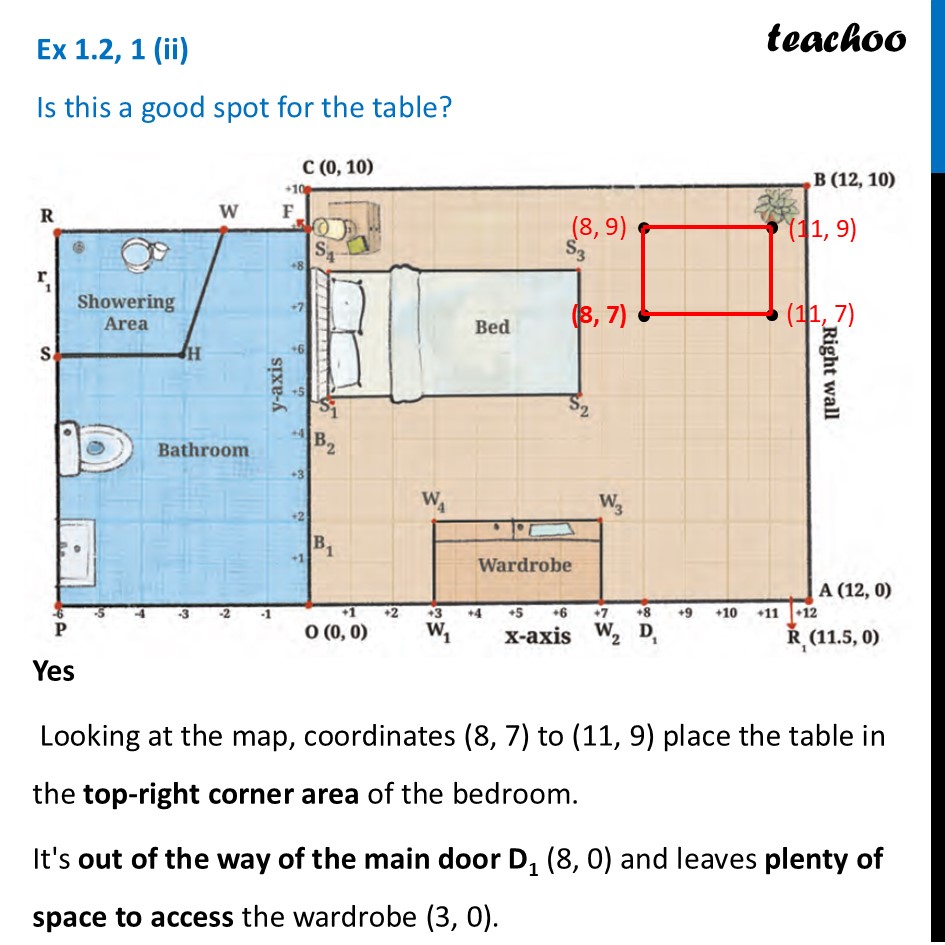
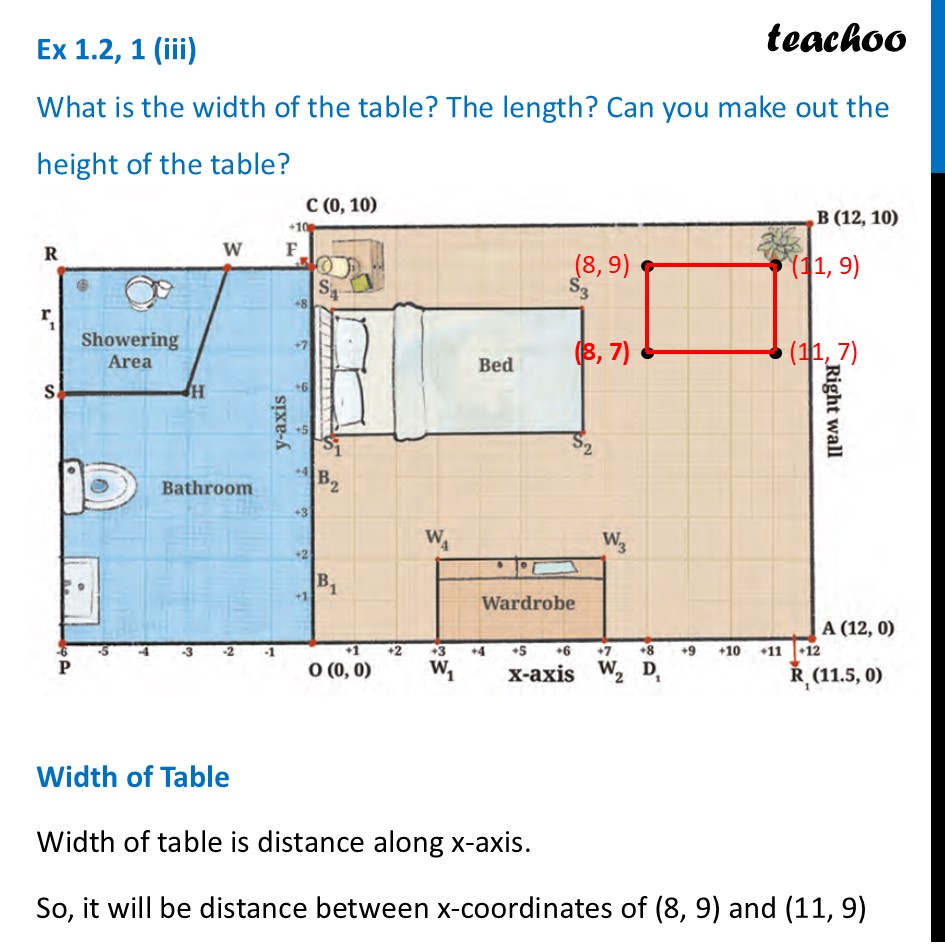
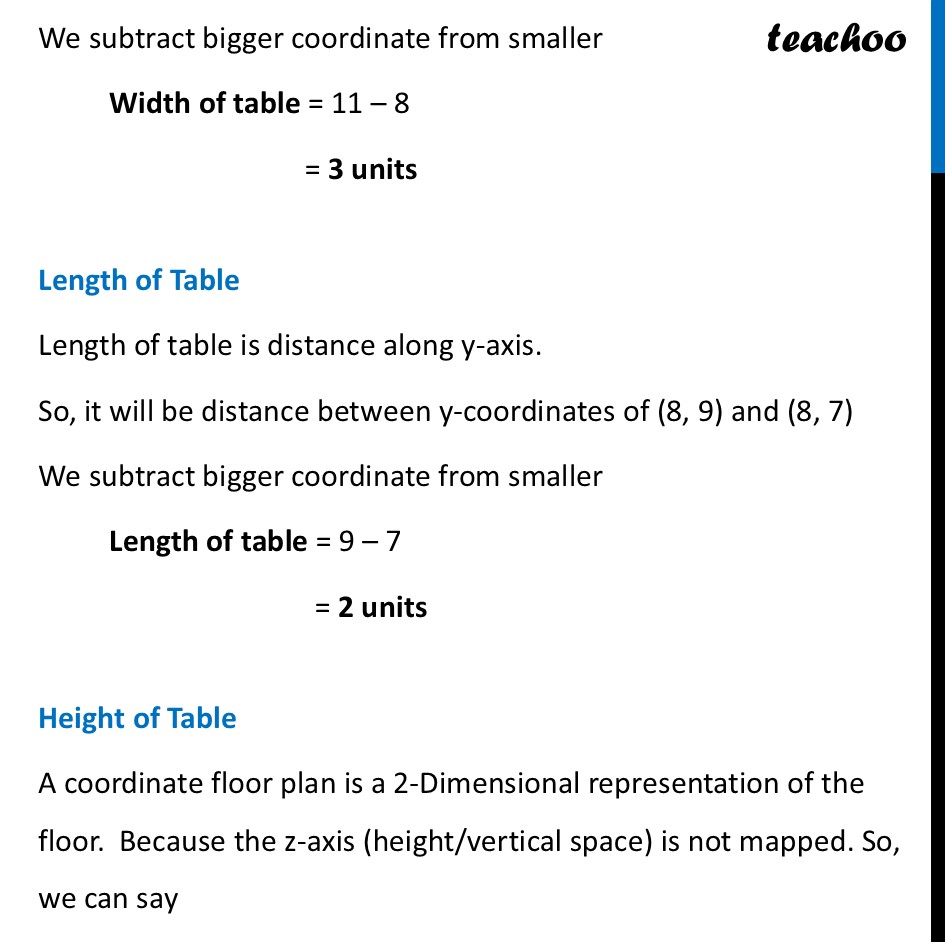
Ex 1.2, 1 On a graph sheet, mark the x-axis and y-axis and the origin O. Mark points from (– 7, 0) to (13, 0) on the x-axis and from (0, – 15) to (0, 12) on the y-axis. (Use the scale 1 cm = 1 unit.) Using Fig. 1.5, answer the given questions. Let’s plot the graph Ex 1.2, 1 (i) Place Reiaan’s rectangular study table with three of its feet at the points (8, 9), (11, 9) and (11, 7). (i) Where will the fourth foot of the table be? Let’s plot the points in Fig 1.5. Joining these points Since the table would be rectangular, Its length and breadth would be the same Completing the rectangle by making the other two lines The point where it joins is our 4th foot of the table Thus, 4th foot of the table is at (8, 7) Ex 1.2, 1 (ii) Is this a good spot for the table? Yes Looking at the map, coordinates (8, 7) to (11, 9) place the table in the top-right corner area of the bedroom. It's out of the way of the main door D1 (8, 0) and leaves plenty of space to access the wardrobe (3, 0). Ex 1.2, 1 (iii) What is the width of the table? The length? Can you make out the height of the table? Width of Table Width of table is distance along x-axis. So, it will be distance between x-coordinates of (8, 9) and (11, 9) We subtract bigger coordinate from smaller Width of table = 11 – 8 = 3 units Length of Table Length of table is distance along y-axis. So, it will be distance between y-coordinates of (8, 9) and (8, 7) We subtract bigger coordinate from smaller Length of table = 9 – 7 = 2 units Height of Table A coordinate floor plan is a 2-Dimensional representation of the floor. Because the z-axis (height/vertical space) is not mapped. So, we can say We cannot determine the height of the table from this graph.
