
Histogram and Frequency Distribution Table
Last updated at April 16, 2024 by Teachoo
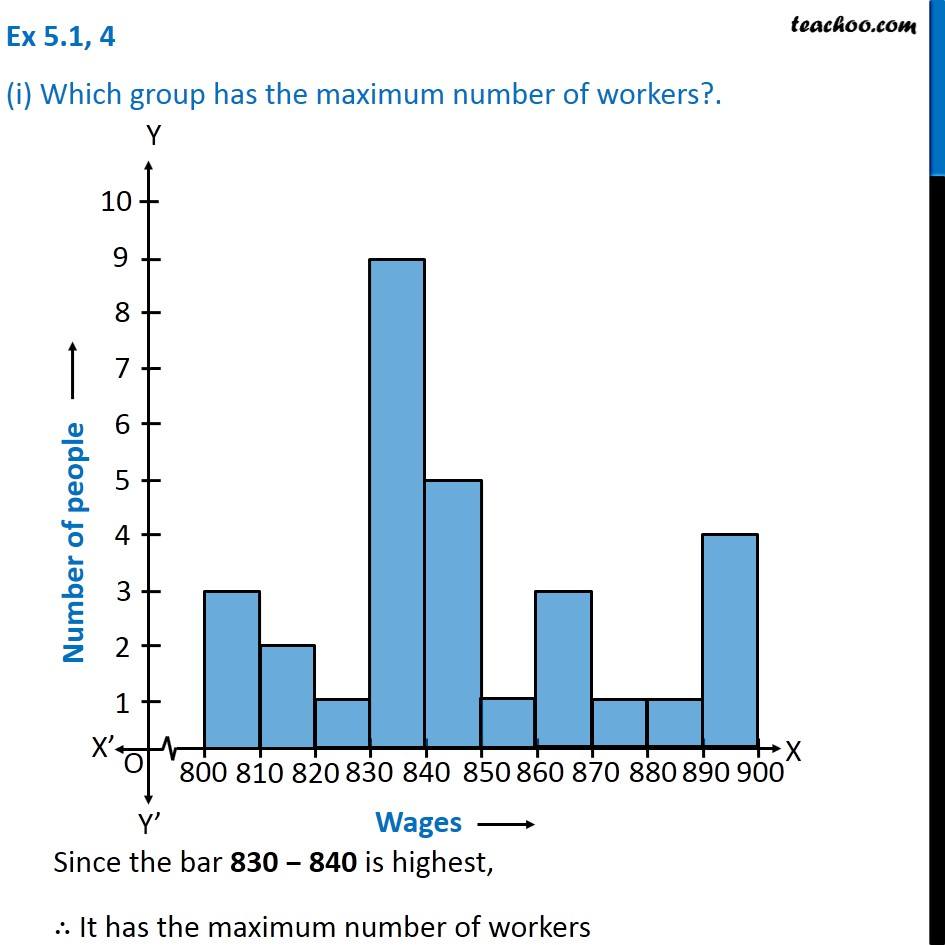
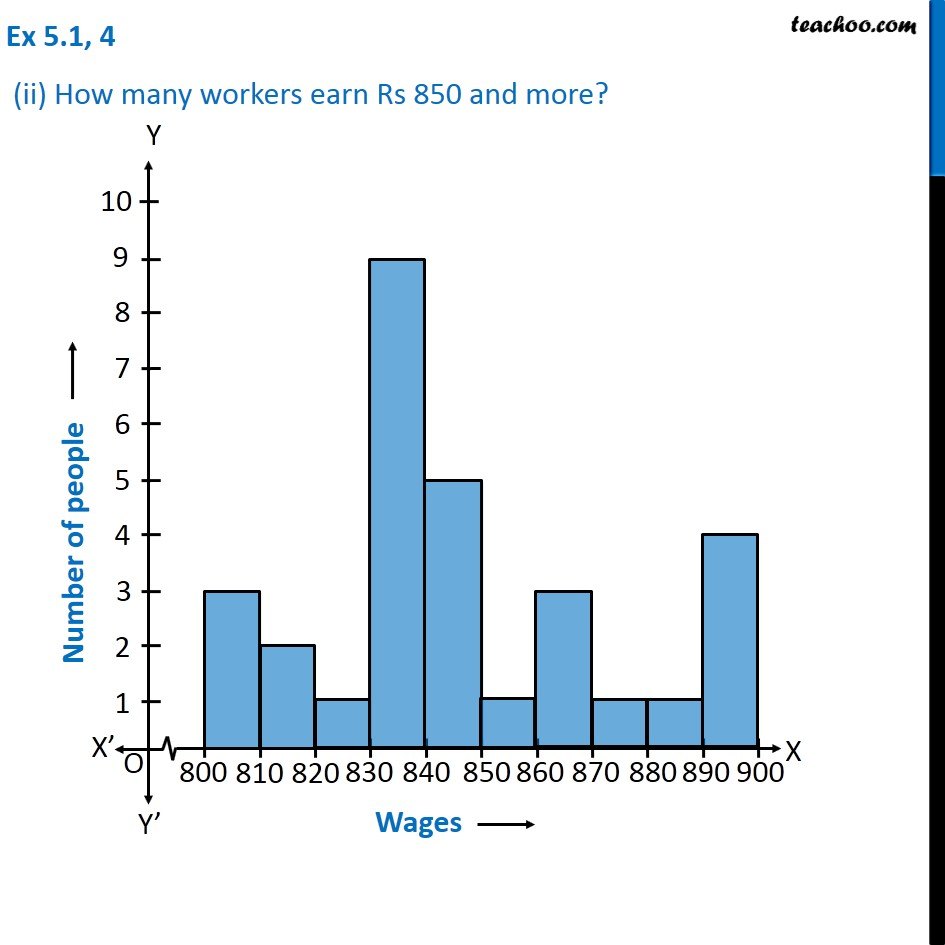
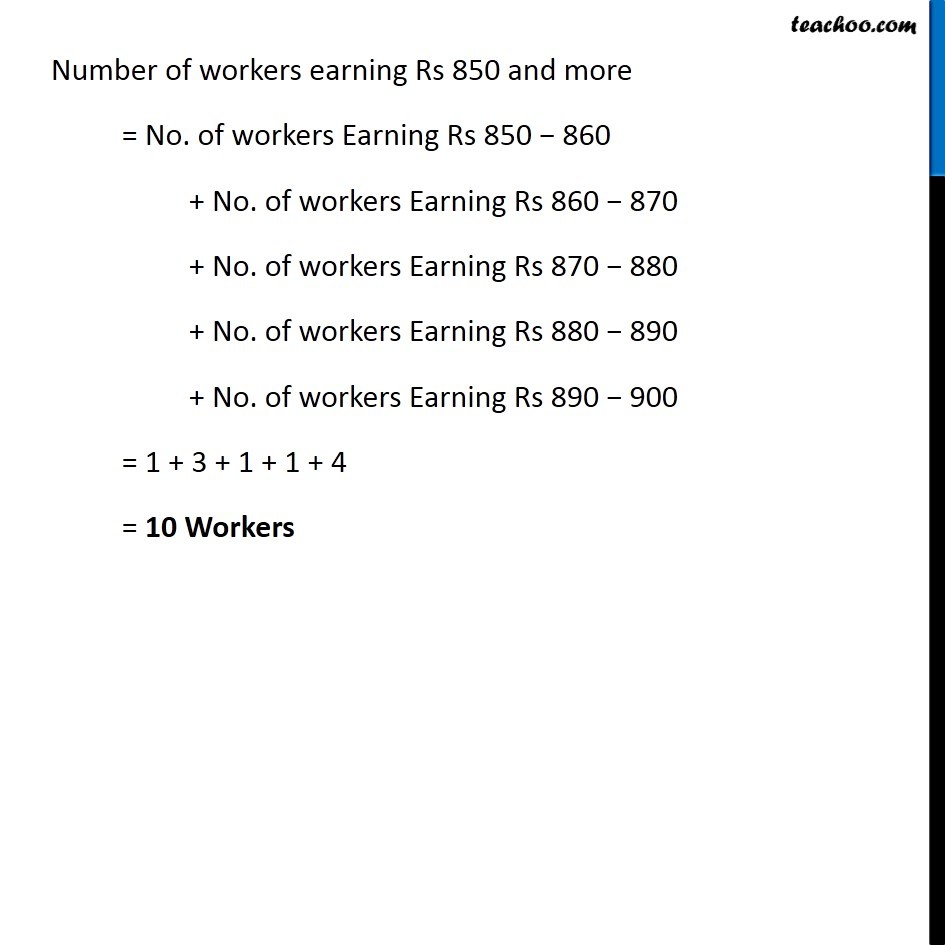
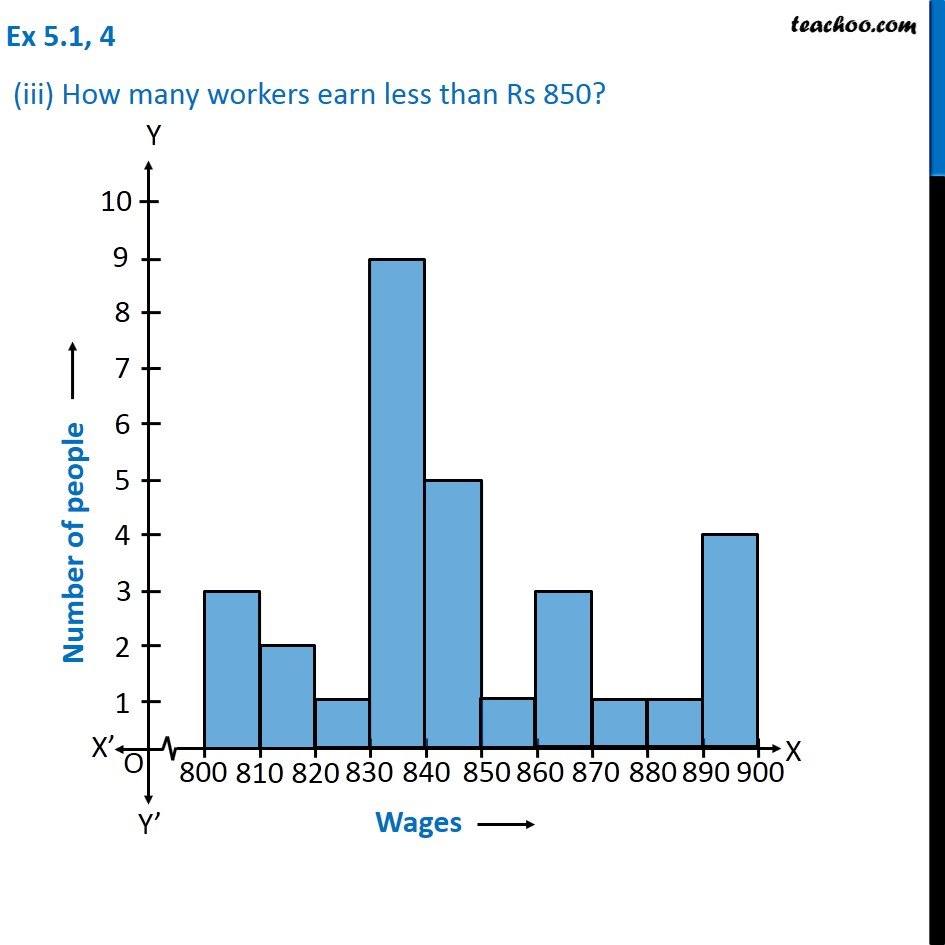
Question 4 Draw a histogram for the frequency table made for the data in question 3, and answer the following questions. Question 4 (i) Which group has the maximum number of workers?. Since the bar 830 − 840 is highest, ∴ It has the maximum number of workers Question 4 (ii) How many workers earn Rs 850 and more?Number of workers earning Rs 850 and more = No. of workers Earning Rs 850 − 860 + No. of workers Earning Rs 860 − 870 + No. of workers Earning Rs 870 − 880 + No. of workers Earning Rs 880 − 890 + No. of workers Earning Rs 890 − 900 = 1 + 3 + 1 + 1 + 4 = 10 Workers Question 4 (iii) How many workers earn less than Rs 850? Number of workers earning less than Rs 850 and more = No. of workers Earning Rs 800 − 810 + No. of workers Earning Rs 810 − 820 + No. of workers Earning Rs 820 − 830 + No. of workers Earning Rs 830 − 840 + No. of workers Earning Rs 840 − 850 = 3 + 2 + 1 + 9 + 5 = 20 Workers
