Histogram and Frequency Distribution Table
Last updated at April 16, 2024 by Teachoo
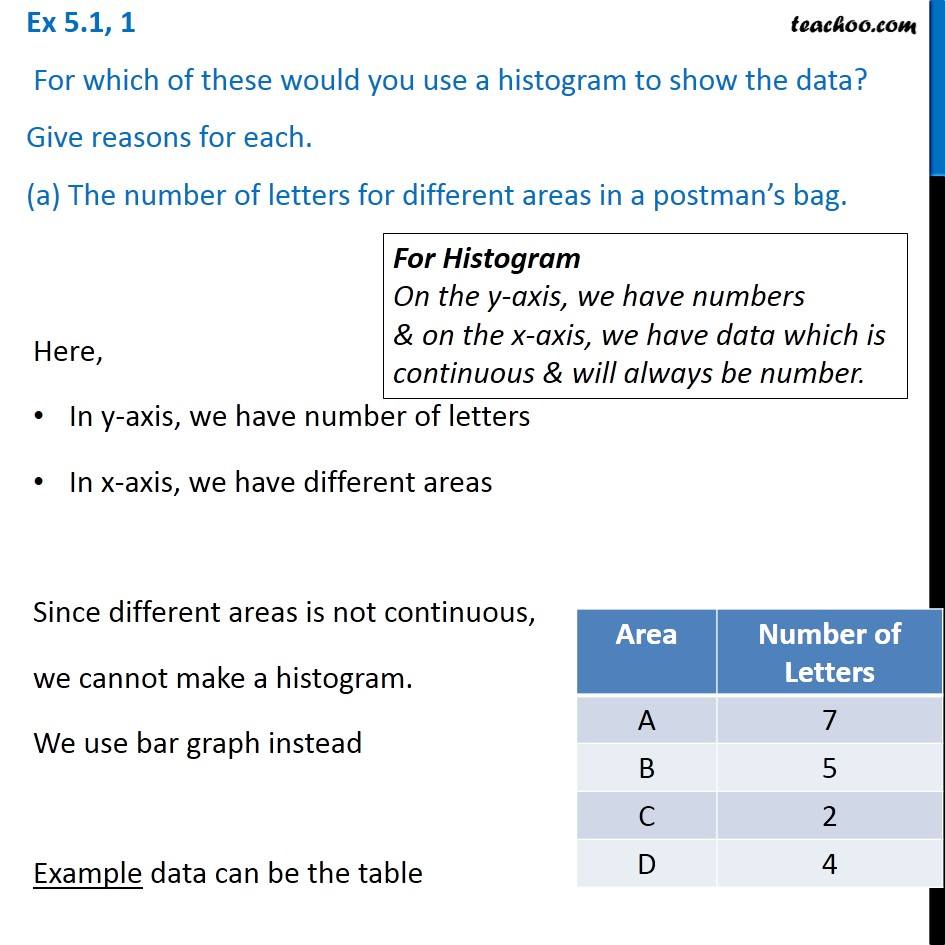
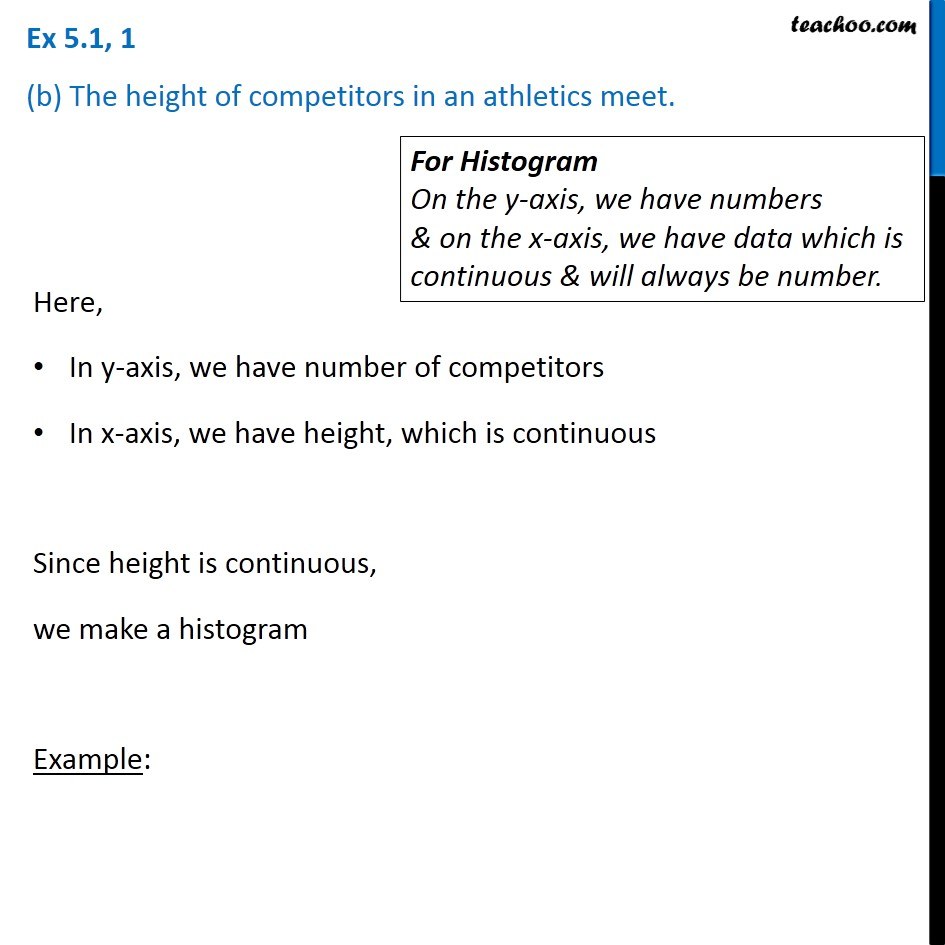
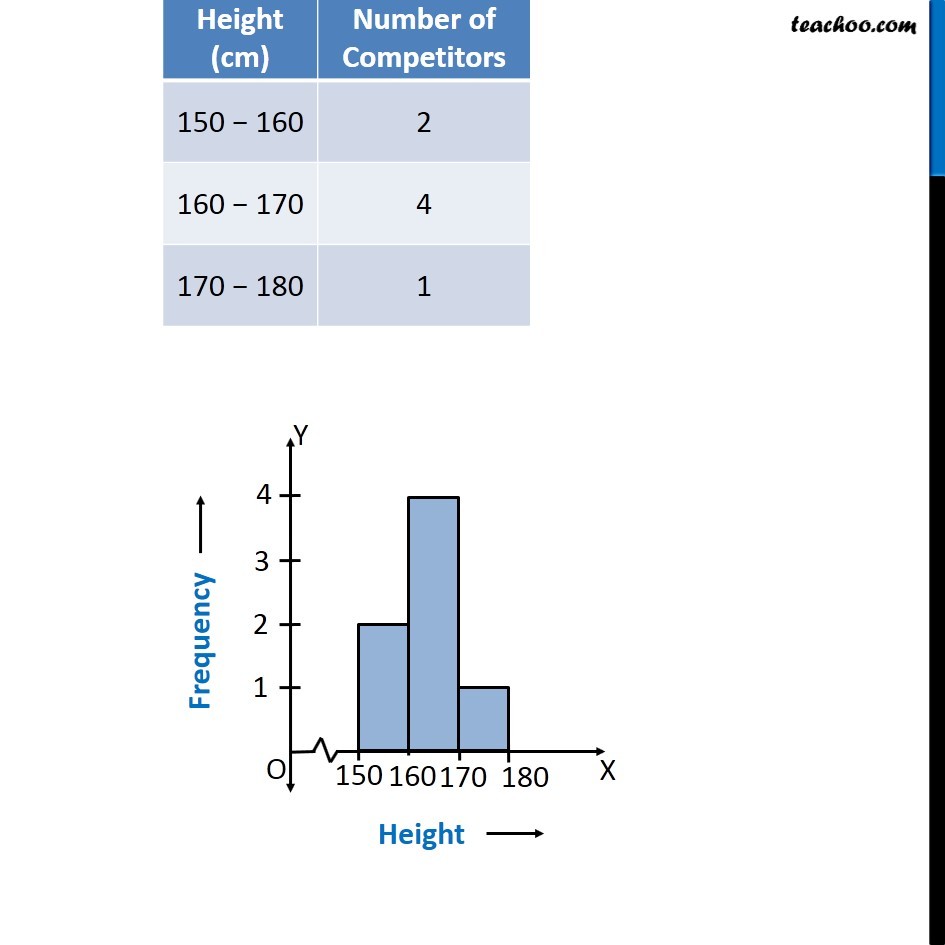
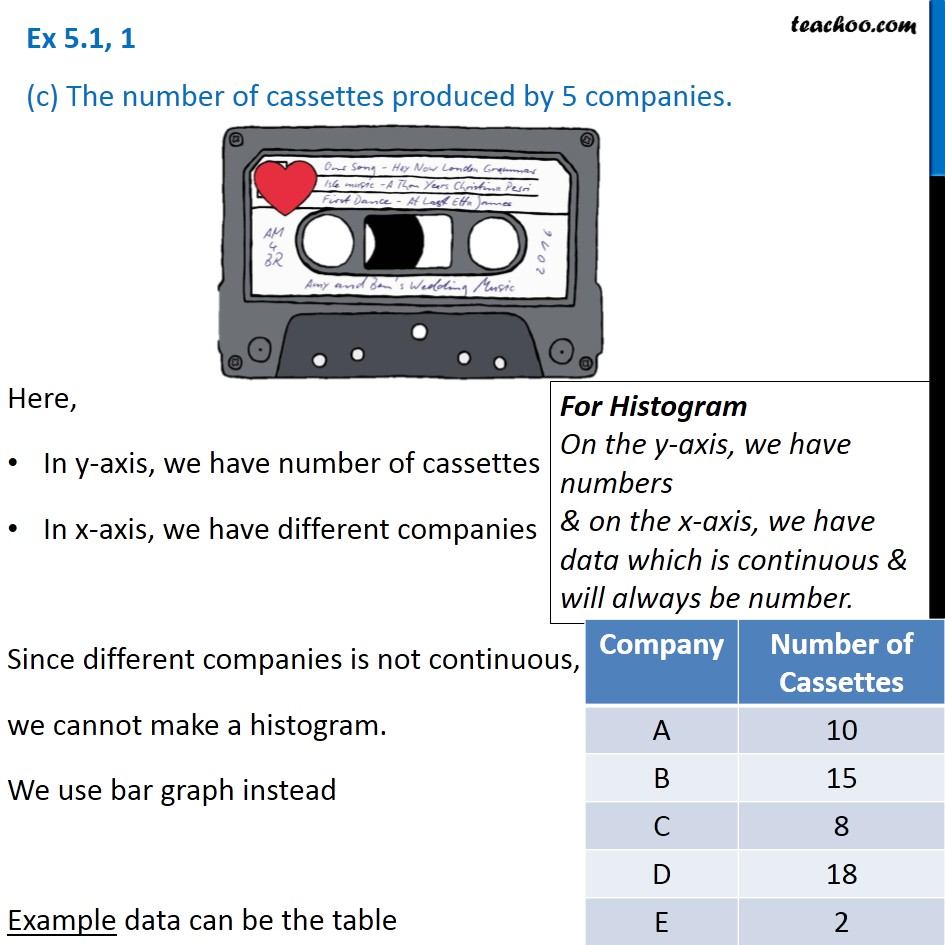
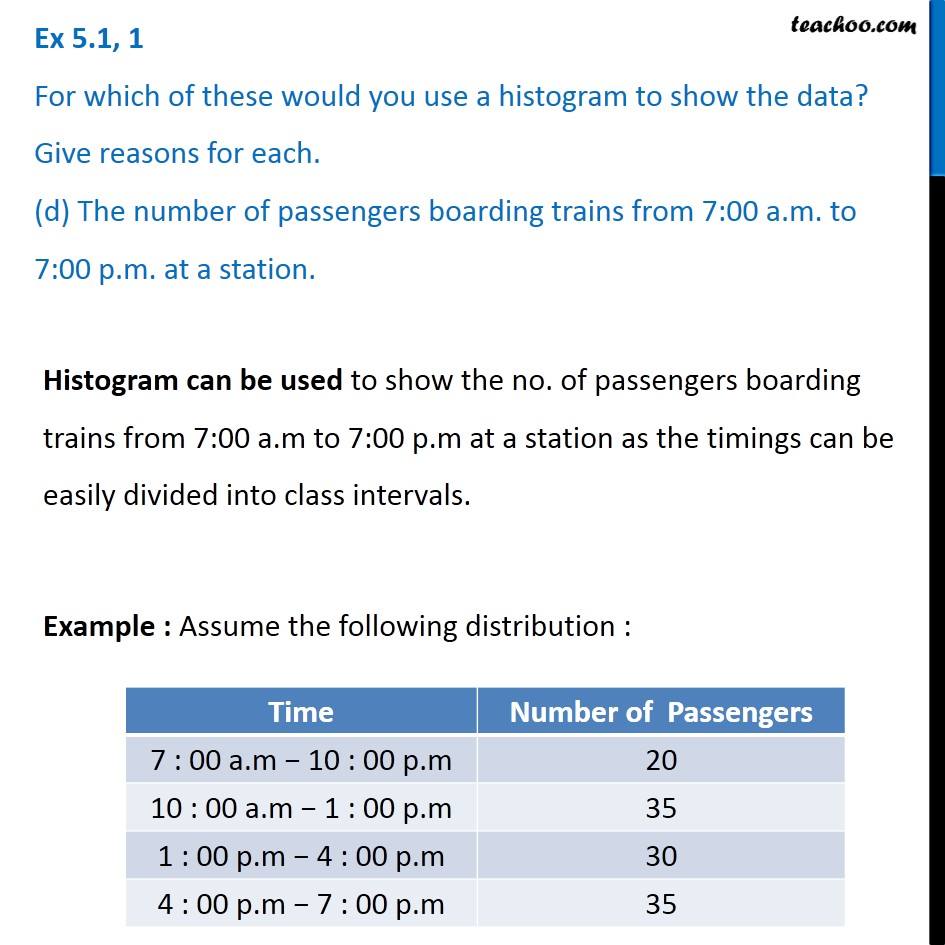
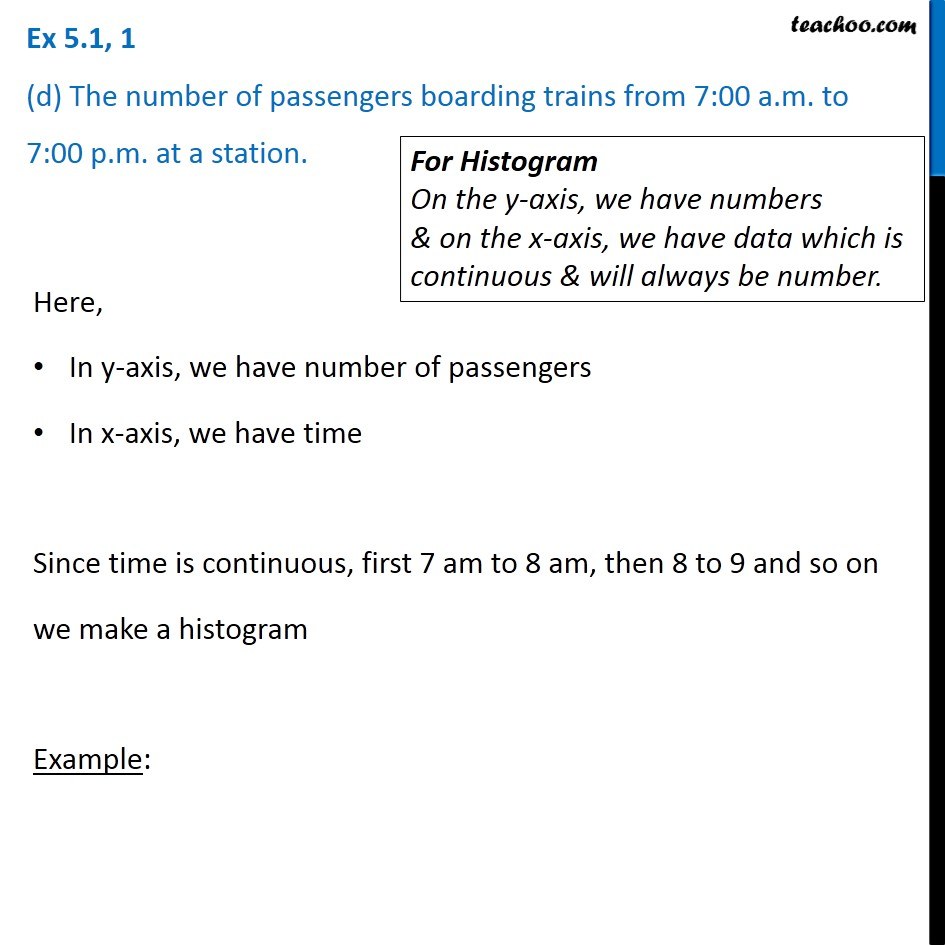
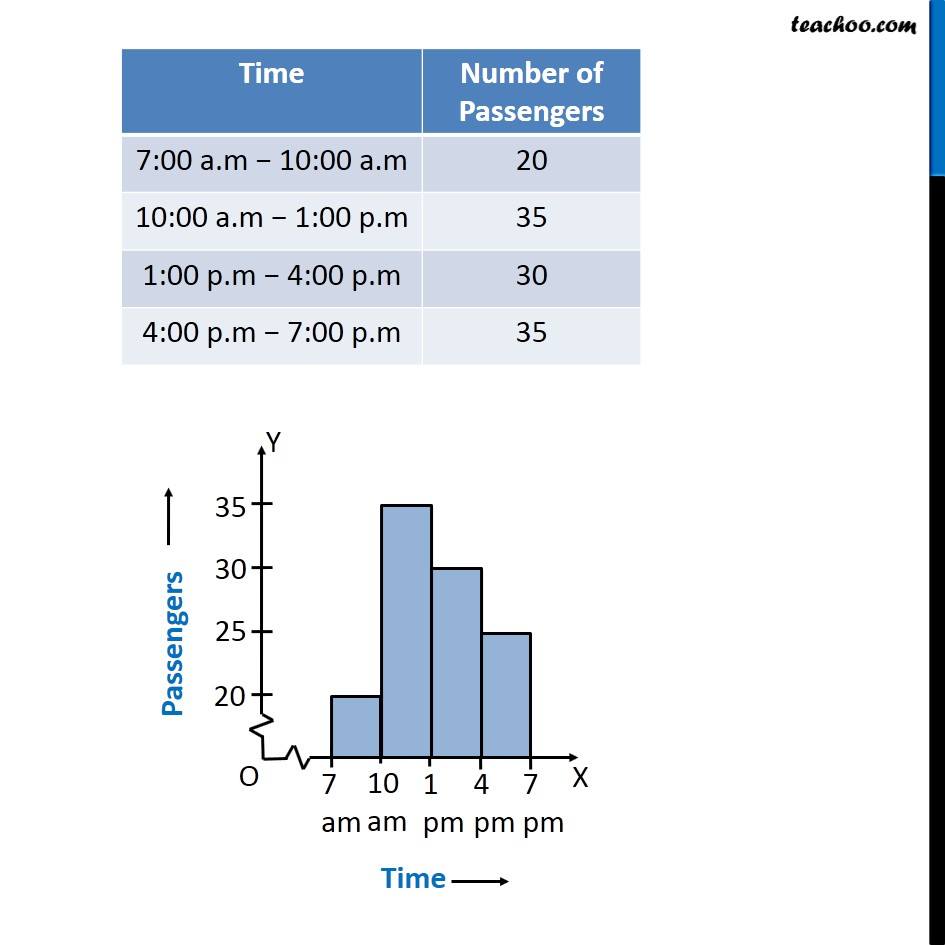
Question 1 For which of these would you use a histogram to show the data? Give reasons for each. (a) The number of letters for different areas in a postman’s bag.For Histogram On the y-axis, we have numbers & on the x-axis, we have data which is continuous & will always be number. Here, In y-axis, we have number of letters In x-axis, we have different areas Since different areas is not continuous, we cannot make a histogram. We use bar graph instead Example data can be the table Bar graph should be used to show this data. Question 1 (b) The height of competitors in an athletics meet.For Histogram On the y-axis, we have numbers & on the x-axis, we have data which is continuous & will always be number. Here, In y-axis, we have number of competitors In x-axis, we have height, which is continuous Since height is continuous, we make a histogram Example: Question 1 (c) The number of cassettes produced by 5 companies.For Histogram On the y-axis, we have numbers & on the x-axis, we have data which is continuous & will always be number. Question 1 For which of these would you use a histogram to show the data? Give reasons for each. (d) The number of passengers boarding trains from 7:00 a.m. to 7:00 p.m. at a station.Histogram can be used to show the no. of passengers boarding trains from 7:00 a.m to 7:00 p.m at a station as the timings can be easily divided into class intervals. Example : Assume the following distribution : Question 1 (d) The number of passengers boarding trains from 7:00 a.m. to 7:00 p.m. at a station.For Histogram On the y-axis, we have numbers & on the x-axis, we have data which is continuous & will always be number. Here, In y-axis, we have number of passengers In x-axis, we have time Since time is continuous, first 7 am to 8 am, then 8 to 9 and so on we make a histogram Example:
